
github.com
Algorithm capable of fully capturing the impact of data drift on performance.
Directory
Published directory entries matching your search.
Algorithm capable of fully capturing the impact of data drift on performance.

The source for financial, economic, and alternative datasets, serving investment professionals.
Analyzes structured data and helps produce queries, insights or visualizations.

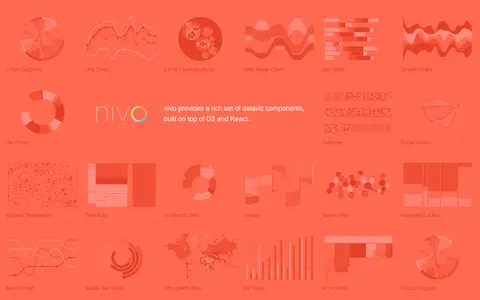
Nivo is a library of React data visualization components built on top of D3 and React. It provides a range of dataviz components including chord diagrams, line charts, bar charts, pie charts, choropleth maps and other visualization types.
Bring multiple data streams into one dashboard.

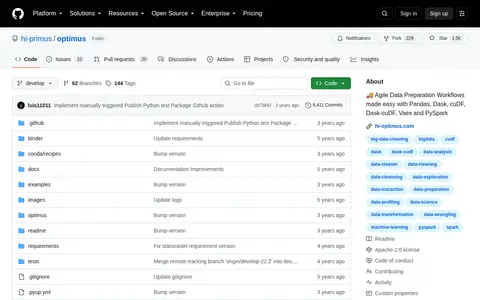
Cleansing, pre-processing, feature engineering, exploratory data analysis and easy ML with PySpark backend.

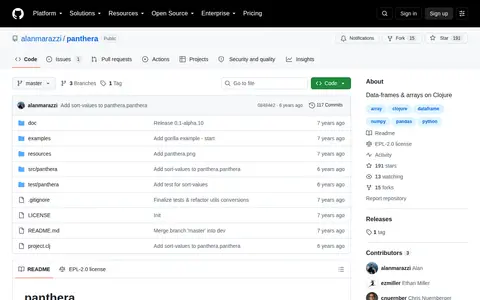
Panthera is an open-source Clojure library available on GitHub that provides data-frame and array functionality for the Clojure programming language. The repository is maintained by alanmarazzi and accepts contributions from users.

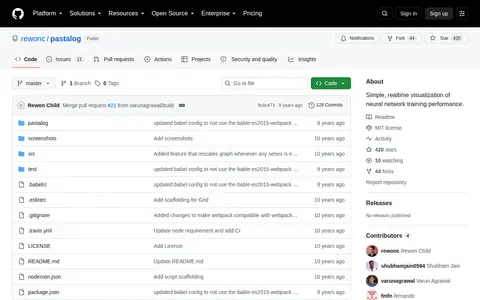
Pastalog is a realtime visualization server for neural network training performance. It works with Lasagne, Keras, Tensorflow, Torch, Theano and other frameworks. Data can be logged through a Python API, a Torch wrapper, or POST requests, and logged metrics update in real time at localhost.

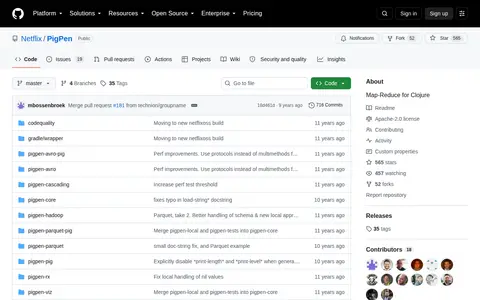
PigPen is an open-source Map-Reduce library for the Clojure programming language, hosted on GitHub under the Netflix organization. The repository includes documentation for getting started, tutorials, and support for data formats including Parquet and Avro.

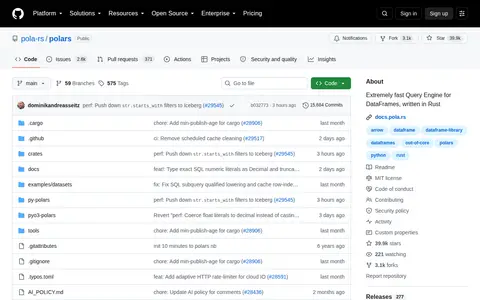
Polars is an extremely fast open-source query engine for DataFrames written in Rust, hosted as a GitHub repository under the pola-rs organization. It is built to handle large datasets, including data volumes that exceed available system RAM.

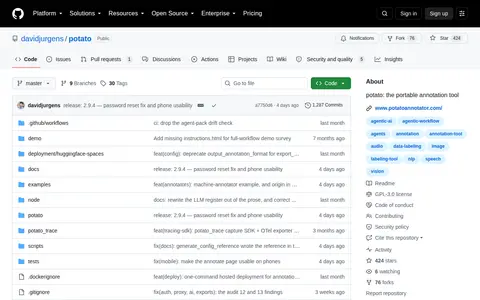
Potato is a portable annotation tool developed by davidjurgens and hosted on GitHub. It supports annotation work across a range of data types and annotation schemes, with documentation available for quick start guidance and use case details.

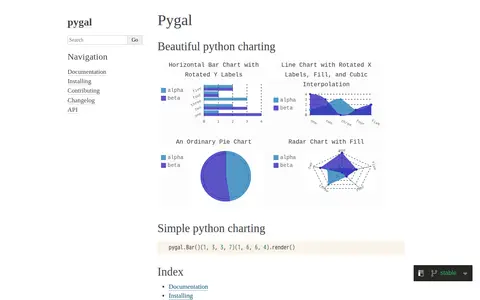
pygal is a Python charting library described as beautiful and simple python charting. Its documentation lists chart types including line, bar, histogram, XY, pie, radar, box, dot, funnel, gauge, pyramid and treemap, and output formats such as SVG, PNG and base 64 data URI.
Open source GPU accelerated data science libraries.

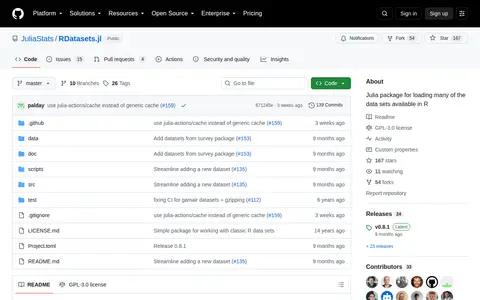
Julia package for loading many of the data sets available in R.

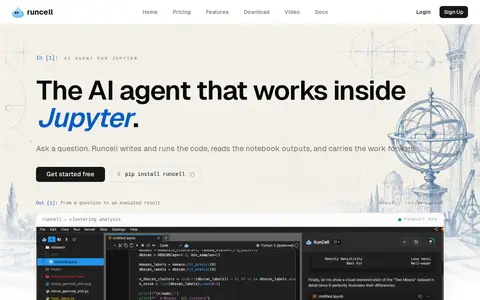
Runcell is an AI agent for Jupyter notebooks that automates writing and executing Python code, debugging, and explaining data analysis results. It operates within the notebook environment, inspecting context and planning multi-step workflows autonomously.

Analyzes structured data and helps produce queries, insights or visualizations.

Analyzes structured data and helps produce queries, insights or visualizations.
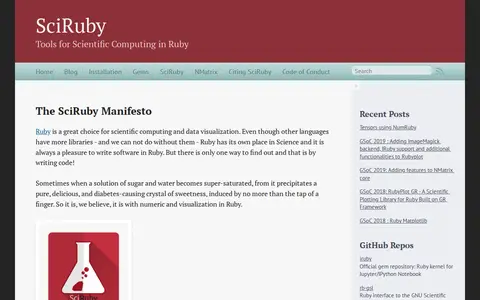
SciRuby is a project providing tools for scientific computing and data visualization in Ruby. Its releases include NMatrix, a linear algebra library with dense and sparse matrix storage and tensor support, alongside visualization and statistics gems. The project describes itself as currently alpha, and it notes its gems are tested but not battle-hardened. SciRuby and NMatrix are available under the BSD three-clause license.

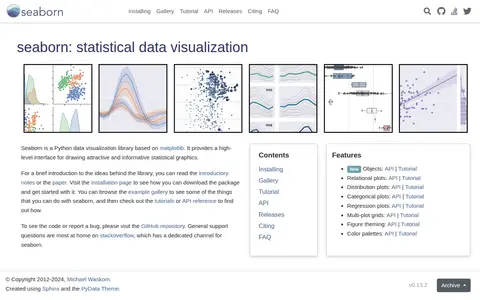
Seaborn is a Python data visualization library based on matplotlib. It provides a high-level interface for drawing statistical graphics, and covers relational, distribution, categorical, regression and multi-plot grids, along with figure theming and color palettes.

Shiny is an R and Python package for creating interactive web apps, letting users interact with data and analysis without web development skills. Apps can be written from R or Python. Questions are answered through Posit Community and Stack Overflow, with subscription support for hosting services.

Analyzes structured data and helps produce queries, insights or visualizations.

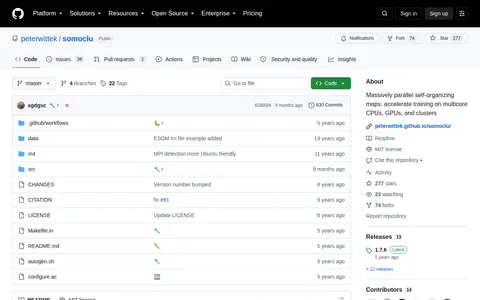
Somoclu is a massively parallel implementation of self-organizing maps, using multicore CPUs, MPI for cluster workload distribution, and CUDA acceleration. It supports OpenMP, MPI, and CUDA, runs on Linux, macOS, and Windows, and offers planar and toroid maps, rectangular and hexagonal grids, and Gaussian and bubble neighborhood functions. Both dense and sparse input data are supported, with interfaces for Python, R, Julia, and MATLAB.

Spark is a fast and general engine for large-scale data processing.

Analyzes structured data and helps produce queries, insights or visualizations.