
github.com
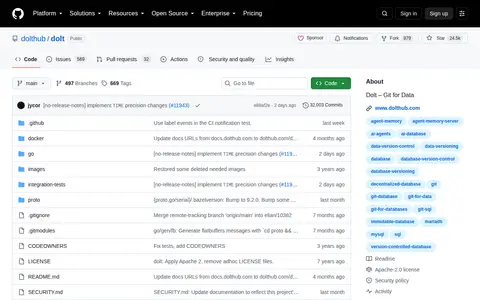
SQL database that you can fork, clone, branch, merge, push and pull just like a git repository.
Directory
Published directory entries matching your search.
SQL database that you can fork, clone, branch, merge, push and pull just like a git repository.

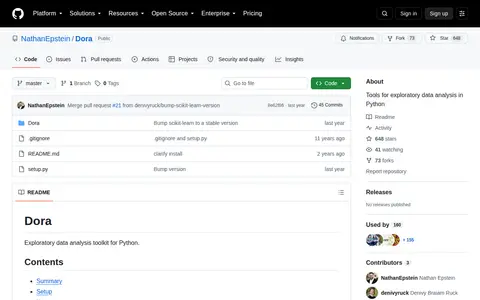
Tools for exploratory data analysis in Python.

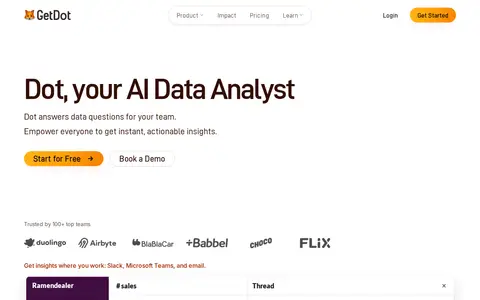
Dot is described as an AI data analyst that answers data questions, with chat, root cause analysis, automated reports and a context agent. Users can ask through Slack, Teams, email or the app, and answers show their queries and sources. A free tier offers 300 one-time credits.

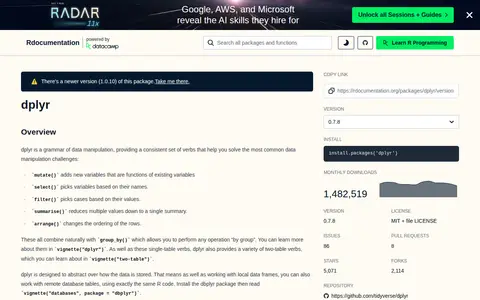
dplyr is an R package providing a grammar of data manipulation with a consistent set of verbs, including mutate(), select(), filter(), summarise() and arrange(), which combine with group_by(). It is designed to abstract over how data is stored, so the same R code works with local data frames and remote database tables via the dbplyr package.
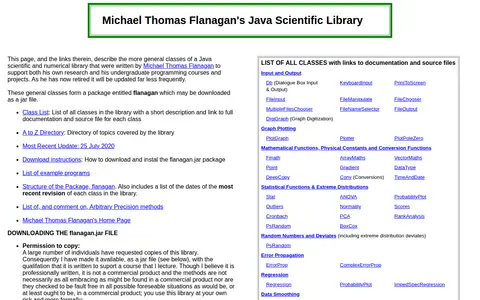
A Java scientific and numerical library written by Michael Thomas Flanagan to support his research and undergraduate programming courses. It is distributed as the flanagan.jar package and includes general classes, example programs and arbitrary precision methods. The author has retired and states it will be updated less frequently. Commercial use, public listing of source codes and redistribution are not permitted.

DriftGuard is a browser-based dashboard for testing and tuning gamepads. It offers drift checks, stick visualization and calibration tools, along with stick, trigger and range calibration, live input display, rumble settings and audio tests. Supported options include selecting target sticks or triggers and saving or restoring calibration.

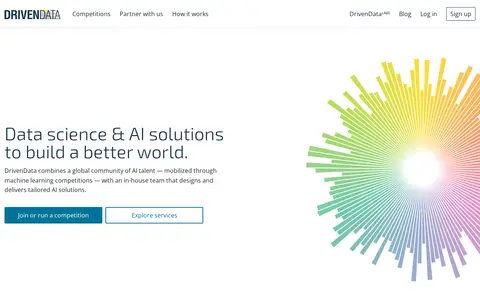
DrivenData hosts online machine learning competitions with social impact and works with mission-driven organizations on data science and engineering projects. It also maintains open-source projects for the data science community and shares prize-winning solutions from past competitions on GitHub. Areas of work include public health, conservation and international development.

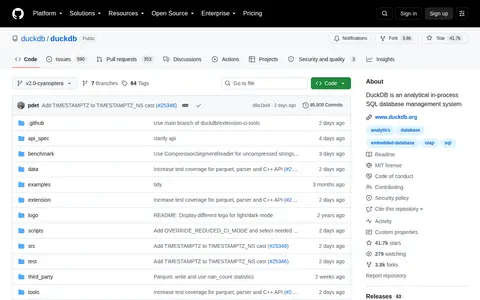
DuckDB is an analytical in-process SQL database management system. It is a high-performance analytical database system designed to be fast, reliable, portable and easy to use, with a rich SQL dialect supporting nested correlated subqueries, window functions, collations and complex types. It is available as a standalone CLI application with clients for Python, R, Java and Wasm.

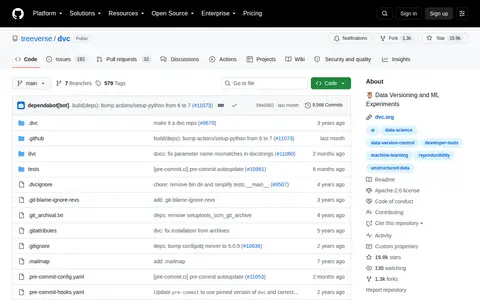
Data Version Control - Git for Data & Models - ML Experiments Management.

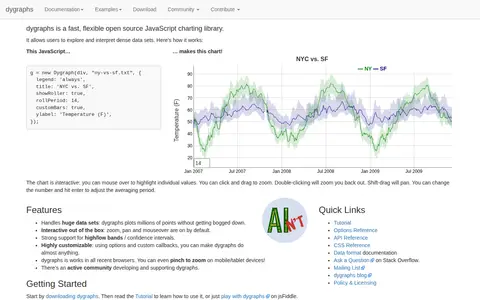
dygraphs is a fast, flexible open source JavaScript charting library that allows users to explore and interpret dense data sets. Charts are interactive, with zoom, pan and mouseover available by default, and the library handles very large data sets. It works in all recent browsers.

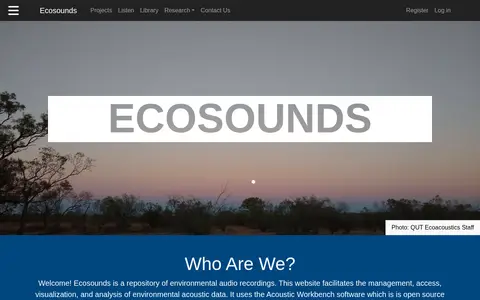
Ecosounds is a repository of environmental audio recordings run by QUT Ecoacoustics to support bioacoustics and ecoacoustics research. The site uses the open source Acoustic Workbench software for management, access, visualization and analysis of environmental acoustic data. Public projects and recordings can be browsed without logging in; participating in analysis requires an account.

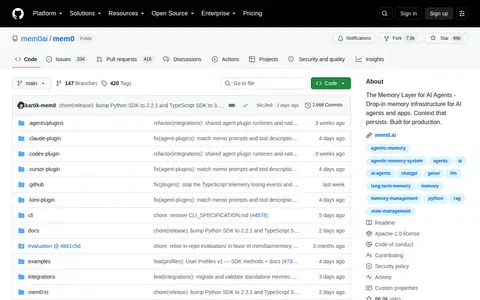
Framework to create ChatGPT like bots over your dataset.

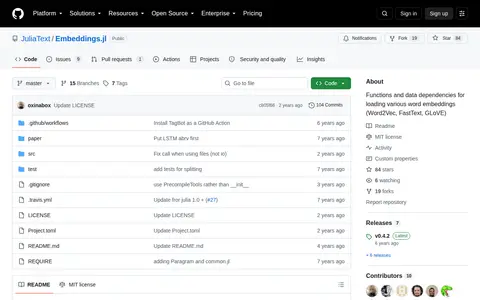
Functions and data dependencies for loading various word embeddings.

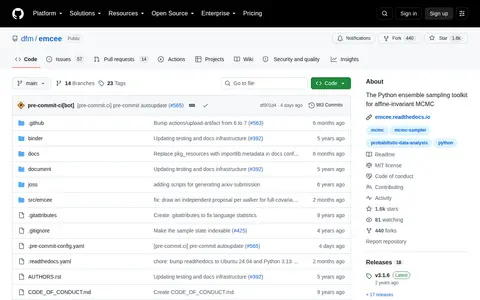
The Python ensemble sampling toolkit for affine-invariant MCMC.
Engaging Data is a virtual workshop and gallery of JavaScript tools, data visualizations, calculators and maps on topics including maps, environment, energy, finance, politics, health and math. A post covers how mask wearing and effectiveness can reduce the coronavirus transmission rate R0; that visualization does not account for vaccines, which the source calls a limitation.

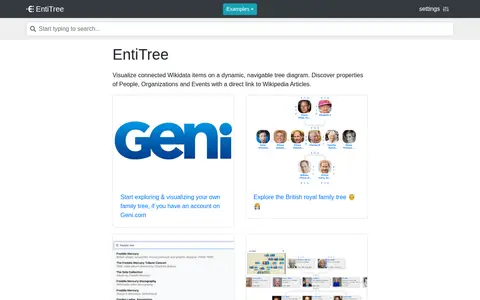
EntiTree is a visualization tool for research and study purposes. It displays connected Wikidata items on dynamic, navigable tree diagrams, with direct links to Wikipedia articles for people, organizations and events. Users can visualize Geni.com family trees, search for public and fictional individuals, and customize display themes. The tool supports multiple labels and languages, and provides a community chat via Telegram.

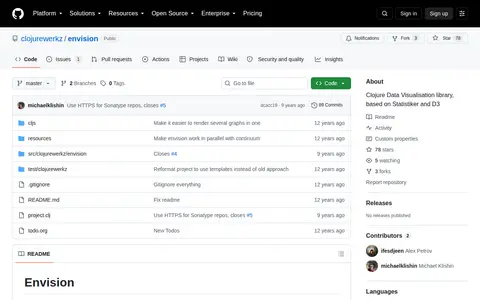
Clojure Data Visualisation library, based on Statistiker and D3.

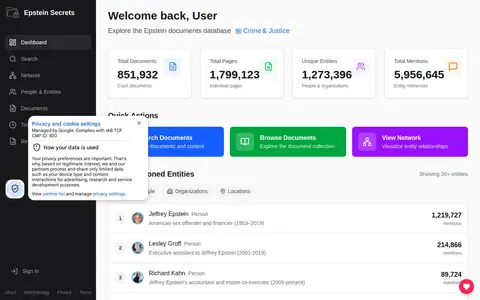
A searchable archive of public Epstein-related documents, including court filings, flight logs, depositions and the black book. It uses AI to extract people, organizations and locations mentioned in the documents and maps their connections in a network visualization.

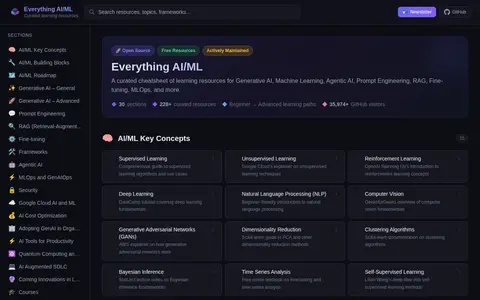
Everything AI/ML is a curated cheatsheet of learning resources covering topics such as generative AI, machine learning, agentic AI, prompt engineering, RAG, fine-tuning and MLOps. It organizes resources into sections, key concepts, interactive visualizations, building blocks and a roadmap from beginner to advanced, with links to external courses, tutorials and documentation.

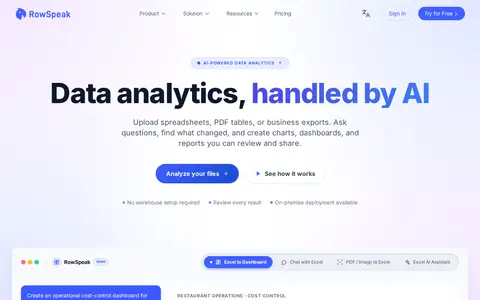
Excelmatic, offered by RowSpeak, is an AI-powered data analytics tool that processes messy Excel, CSV, PDF, and image tables. It uses AI to identify trends, explain data changes, generate charts, dashboards, and reports, cleanse data, and convert files between formats including images and PDFs to editable Excel spreadsheets.

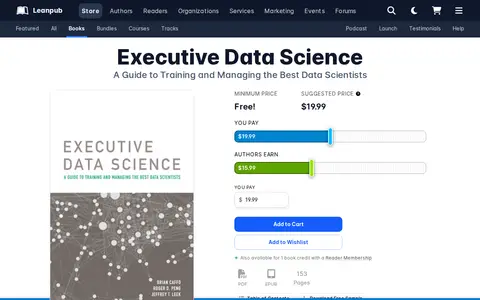
A book by Brian Caffo, Roger D. Peng and Jeffrey Leek on assembling and leading a data science enterprise, based on the Johns Hopkins Executive Data Science Specialization. It covers a crash course in data science, recruiting and evaluating a team, and the structure of the data science pipeline. Available as PDF and EPUB; printed copies are sold through Lulu.
Exhibit is an open source publishing framework for creating data-rich interactive web pages. It provides advanced text search and filtering, along with interactive maps, timelines and other visualizations. The software is licensed under the BSD license and was originally sponsored partially by The Andrew W. Mellon Foundation as part of the SIMILE project.

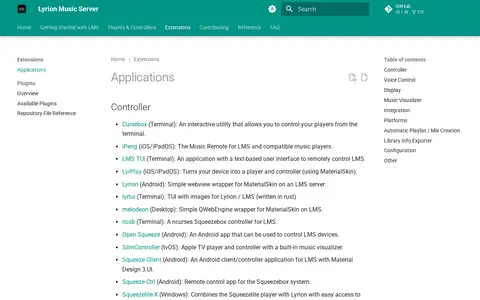
This is the official applications extensions page for Lyrion Music Server. It lists available extensions that add functionality including controller support, voice control, music visualization, integration with other tools, and automated playlist creation.

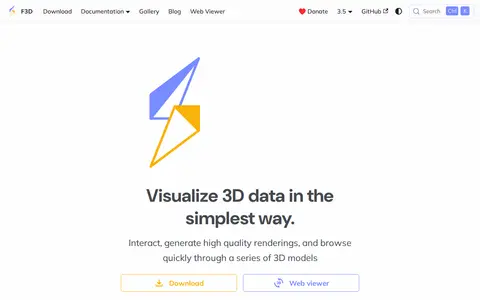
F3D is a fast, minimalist 3D viewer desktop application that is free to use, open source and cross-platform. It visualizes 3D data, with features including realistic rendering, animations, CAD designs, Gaussian splatting, volume rendering and scientific visualization. F3D was originally created by Kitware SAS and relies on open-source projects including VTK, OCCT and Assimp.