
data.gov.in
Open Government Data Platform India applies AI to data analysis, extraction, visualization, or business intelligence.
Directory
Published directory entries matching your search.
Open Government Data Platform India applies AI to data analysis, extraction, visualization, or business intelligence.

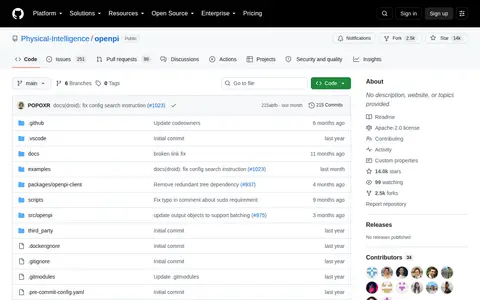
Open-source project that applies AI to data analysis, extraction, visualization, or business intelligence.

Open-source project that applies AI to data analysis, extraction, visualization, or business intelligence.

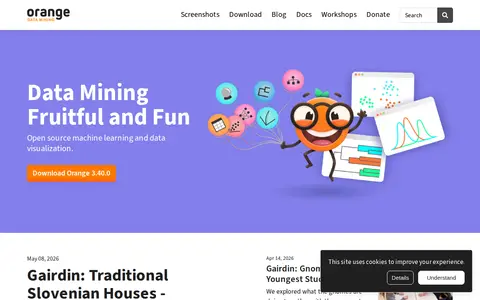
Orange is an open-source machine learning and data visualization toolbox. It offers visual programming in which widgets are placed on a canvas and connected to load datasets and analyze data. It supports interactive visualization methods including box plots, scatter plots, decision trees, hierarchical clustering, heatmaps, MDS, t-SNE and linear projections. Extensions add text mining, network analysis and other specialized capabilities.

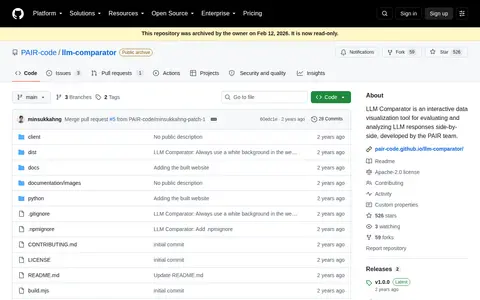
LLM Comparator is an interactive data visualization tool for evaluating and analyzing large language model responses side-by-side, developed by the PAIR team. It includes a Python library for creating JSON files and a defined JSON data format.

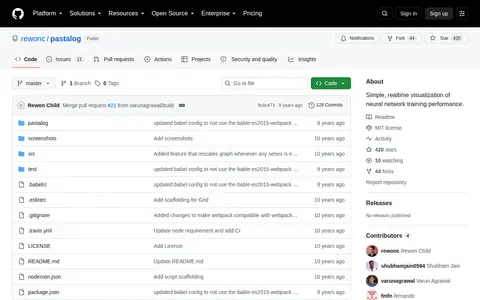
Pastalog is a realtime visualization server for neural network training performance. It works with Lasagne, Keras, Tensorflow, Torch, Theano and other frameworks. Data can be logged through a Python API, a Torch wrapper, or POST requests, and logged metrics update in real time at localhost.

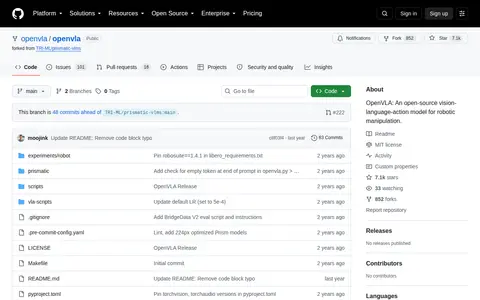
Open-source project that applies AI to data analysis, extraction, visualization, or business intelligence.

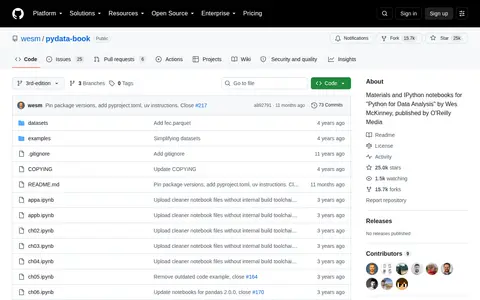
The repository holds materials and IPython notebooks for "Python for Data Analysis, 3rd Edition" by Wes McKinney, published by O'Reilly Media. Notebooks cover chapters on Python basics, NumPy, pandas, data loading, cleaning, visualization, time series and modeling libraries, plus appendices. The code is released under the MIT license.

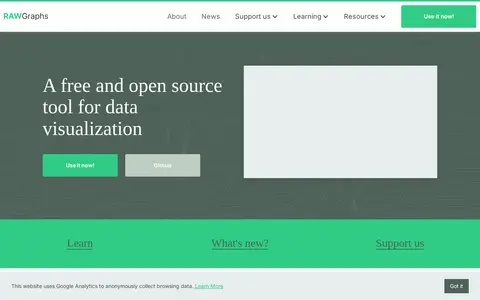
RAWGraphs is a free and open source tool for data visualization. It is a web app that offers almost 30 visual models to visualize quantities, hierarchies and time series. Data inserted is processed only by the web browser, and projects can be saved or exported as vector or raster images.

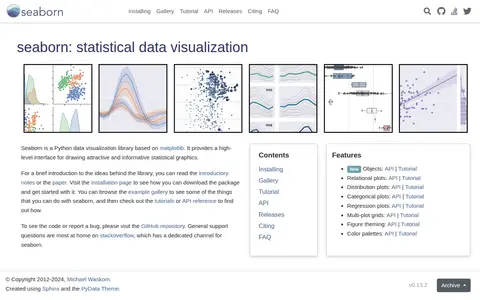
Seaborn is a Python data visualization library based on matplotlib. It provides a high-level interface for drawing statistical graphics, and covers relational, distribution, categorical, regression and multi-plot grids, along with figure theming and color palettes.

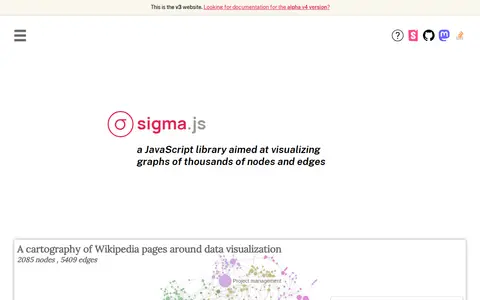
Sigma.js is a WebGL-powered JavaScript library for interactive graph visualization, built on graphology. It provides GPU-accelerated rendering, built-in pan, zoom, hover and multi-touch interactions, and works with React, Angular, Vue or vanilla JavaScript. Layouts, metrics and community detection come via graphology's standard library.

Tableau applies AI to data analysis, extraction, visualization, or business intelligence.

Workflow tool to automatically organize data visualization output.

TensorFlow's Visualization Toolkit.
Variance applies AI to data analysis, extraction, visualization, or business intelligence.

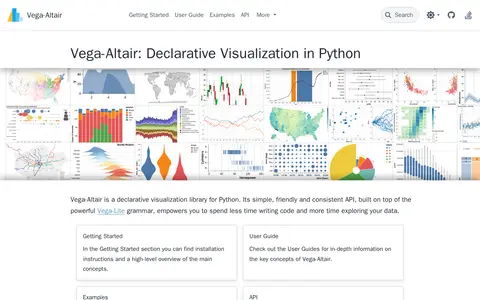
Vega-Altair is a declarative visualization library for Python with a simple, friendly and consistent API built on the Vega-Lite grammar. The project states it is not affiliated with Altair Engineering, Inc.

VisPy is a high-performance interactive 2D/3D data visualization library that uses GPUs through OpenGL to display large datasets. It offers a Pythonic, NumPy-aware interface for OpenGL ES 2.0 called gloo and an experimental OpenGL backend for matplotlib. The project is described as young and under heavy development, with high-level plotting interfaces still experimental.

The visualizer is a tool developed by the cheminformatics department of the Swiss Federal Institute of Technology for rendering complex datasets. Its modules, placed on a browser page, display information as tables, charts, matrices or lists and interact through a central API of variables and actions. Visualization starts by passing three JSON file URLs in the browser address bar. It is released under the MIT license.

WhatSTheBigData applies AI to data analysis, extraction, visualization, or business intelligence.

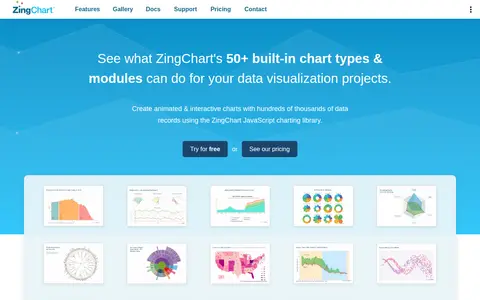
ZingChart is a dependency-free pure JavaScript charting library for data visualization. It includes over 50 built-in chart types and modules, uses simple JSON configuration, and offers integrations with popular JavaScript frameworks including React, Angular, and Vue.

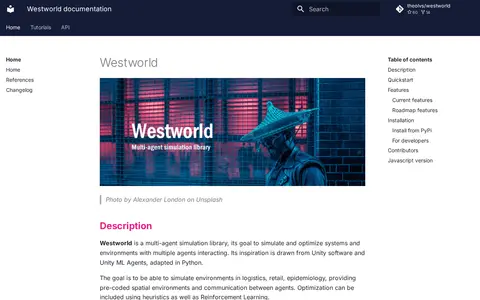
Westworld is a multi-agent simulation library for simulating and optimizing systems with multiple interacting agents. Inspired by Unity and Unity ML Agents and adapted in Python, it provides grid environments, agents, obstacles, collectibles and triggers, spawning, simple pathfinding and wandering behaviors, maze generation and simulation visualization and export. The project is described as extremely experimental and in alpha release.
Post by Travis Tang from DataDrivenInvestor.

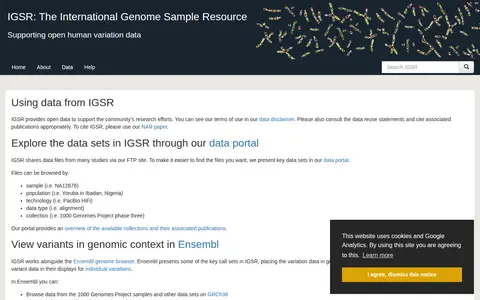
IGSR, the International Genome Sample Resource, provides open human variation data. Data files from many studies are shared via FTP, with key data sets presented in a data portal browsable by sample, population, technology, data type and collection. Ensembl presents some key call sets in genomic context. Bulk downloads are recommended via Globus, with FTP and Aspera also available.

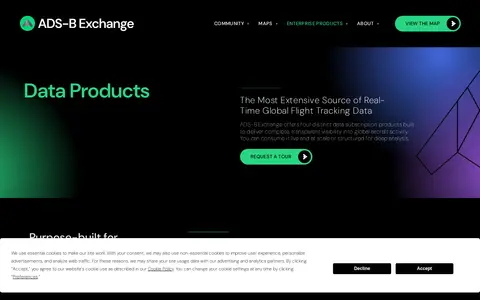
ADS-B Exchange offers live flight APIs and historical datasets of aircraft data for research, analytics and integration. Live positions refresh every 250 milliseconds, with update frequency options of 5s, 500ms or 250ms. Daily positions provide a record of global aircraft positions refreshed every 24 hours, and daily operations deliver completed flight events. Data is available via API, streaming and data feeds.