
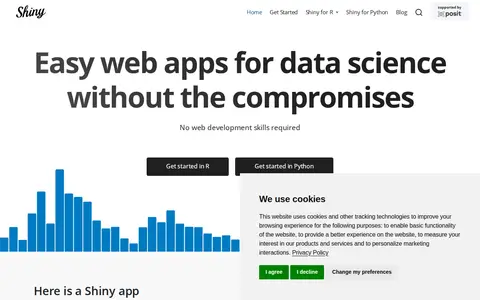

Shiny is an R and Python package for creating interactive web apps, letting users interact with data and analysis without web development skills. Apps can be written from R or Python. Questions are answered through Posit Community and Stack Overflow, with subscription support for hosting services.
windML
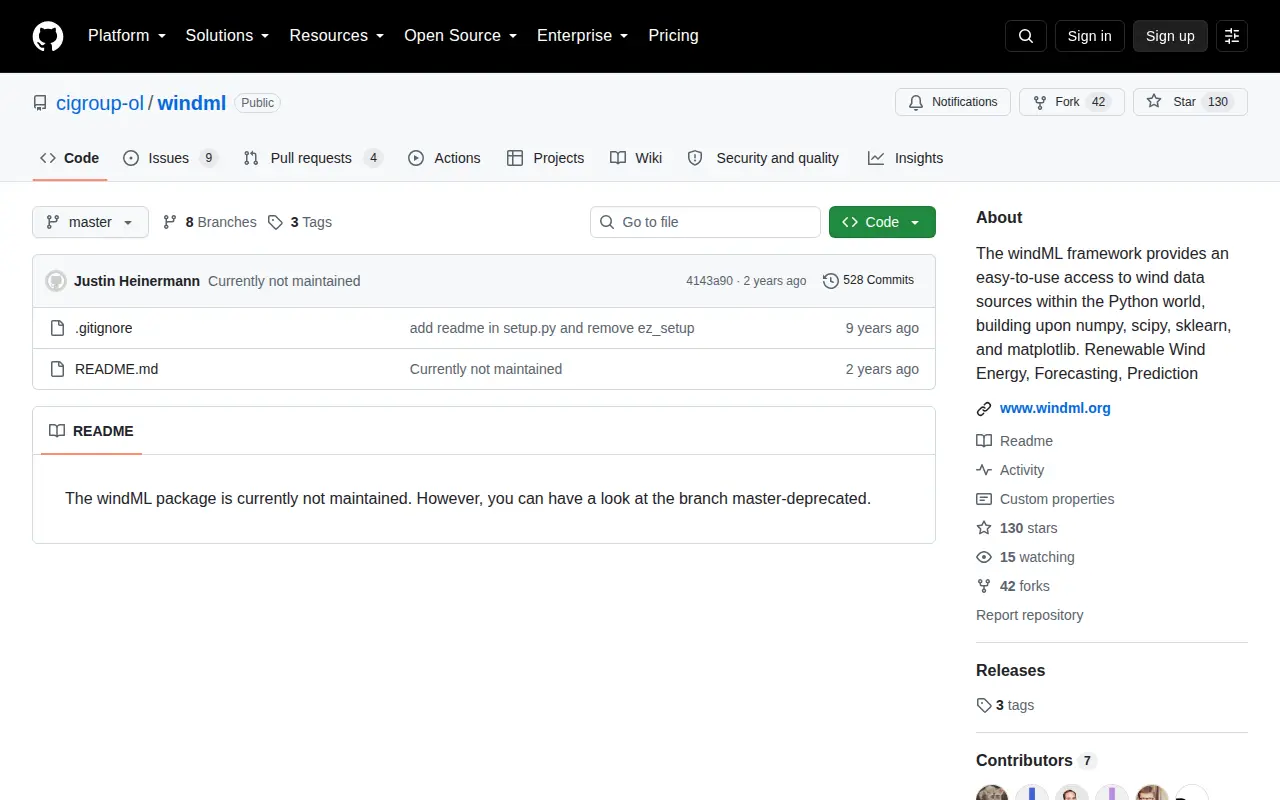
The windML framework provides access to wind data sources within Python, building upon numpy, scipy, sklearn and matplotlib. It relates to renewable wind energy forecasting and prediction. The package is currently not maintained, though a deprecated branch is available.
Features
- provides an easy-to-use access to wind data sources within the Python world Source: github.com
Limitations
- The windML package is currently not maintained Source: github.com
Links
Tags
-
0Shiny is an R and Python package for creating interactive web apps, letting users interact with data and analysis without web development skills. Apps can be written from R or Python. Questions are answered through Posit Community and Stack Overflow, with subscription support for hosting services.
-
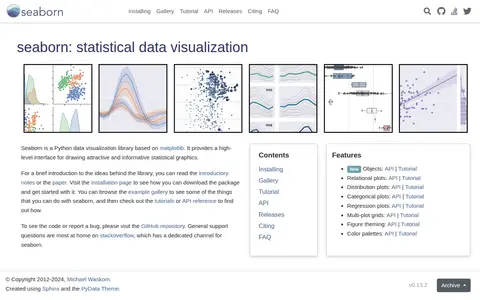
0Seaborn is a Python data visualization library based on matplotlib. It provides a high-level interface for drawing statistical graphics, and covers relational, distribution, categorical, regression and multi-plot grids, along with figure theming and color palettes.
-
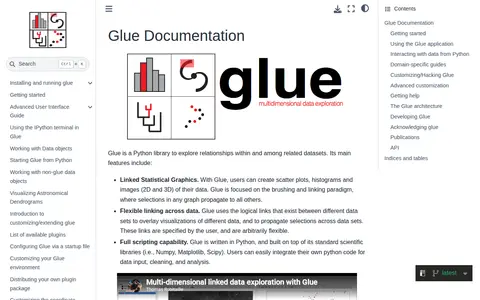
0Glue is a Python library for exploring relationships within and among related datasets. It provides linked statistical graphics such as scatter plots, histograms and 2D and 3D images, with selections in one graph propagating to others. It supports user-specified links across datasets and scripting through Python's scientific libraries.
-
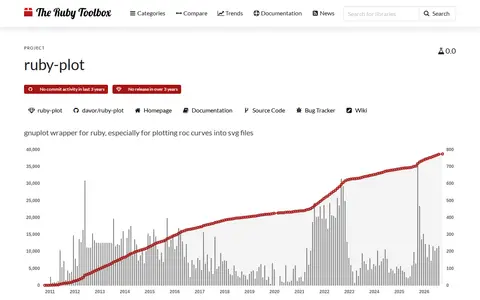
0ruby-plot is a Ruby wrapper around gnuplot, especially for plotting ROC curves into SVG files. It requires gnuplot to be installed and has had no release in over three years.
-
0Loic Tetrel is a blog about computer science and data science topics. Posts cover subjects such as enabling GPU acceleration in Windows 11 Hyper-V virtual machines, using Android TV without a Google account, and Windows/Linux dual-boot.
-
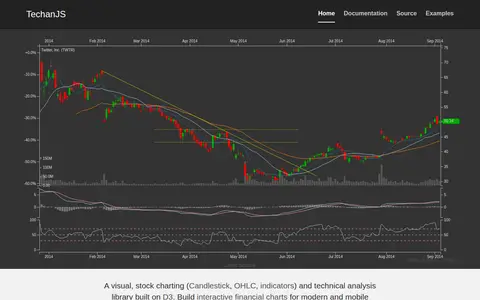
0TechanJS is a library built on D3 for financial charting and technical analysis. It provides visual stock charting, including candlestick, OHLC and indicators, for building interactive financial charts for modern and mobile browsers.
Community notes
Reviews and discussion
No reviews yet
Be the first to share how this project worked for you.
Join the discussion
Sign in with a verified account to leave a review or join the discussion.
Sign in to review