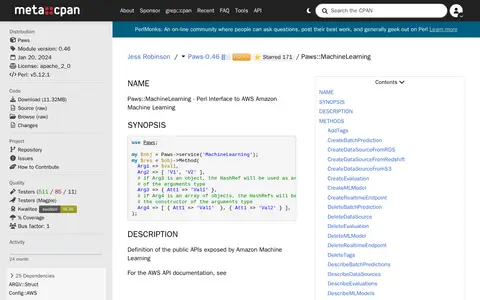

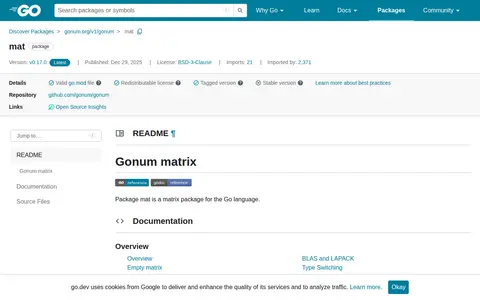
The mat package from Gonum provides implementations of float64 and complex128 matrix structures and linear algebra operations on them in Go. It offers interfaces for matrix classes, concrete implementations such as Dense and SymDense, methods for using matrix data, and types for matrix factorizations such as QR and LU.

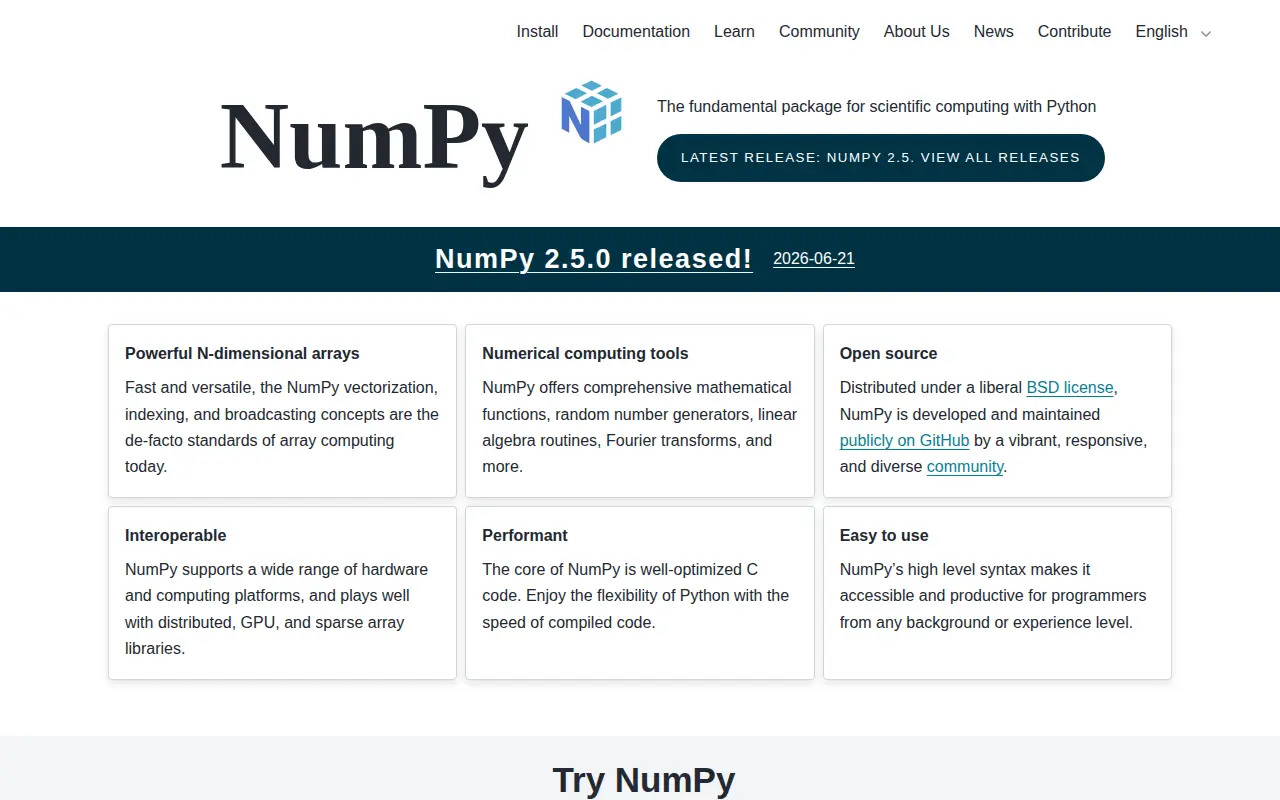
NumPy
NumPy is a Python library providing a multidimensional array object and routines for fast operations on arrays, including mathematical, logical, sorting, Fourier transforms, linear algebra and random simulation. It is open source under a BSD license and is described as the fundamental package for scientific computing in Python, with core code written in optimized C.
Features
- comprehensive mathematical functions, random number generators, linear algebra routines, Fourier transforms Source: numpy.org
Links
Tags
-
0The mat package from Gonum provides implementations of float64 and complex128 matrix structures and linear algebra operations on them in Go. It offers interfaces for matrix classes, concrete implementations such as Dense and SymDense, methods for using matrix data, and types for matrix factorizations such as QR and LU.
-
0A membership program with a Udemy course on basic data concepts, weekly knowledge jams, career development tools and mentorship services. A limited-time membership is offered at $50 USD per year, cancellable anytime, and participants can join a LinkedIn community.
-
0
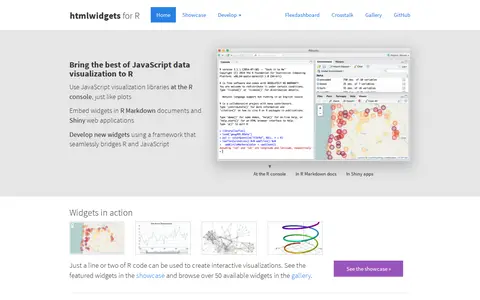
HTML widgets are R packages that produce interactive web visualizations, working like R plots. A line or two of R code produces a D3 graphic or Leaflet map. Widgets run at the R console and can be embedded in R Markdown reports and Shiny web applications. The page lists widget examples including Leaflet, dygraphs, Plotly and Highcharter, and describes composing dashboards with flexdashboard and linking widgets with crosstalk. New widgets can be developed by bridging R and JavaScript.
-
0, a pluggable architecture for data and image processing, which can.
-
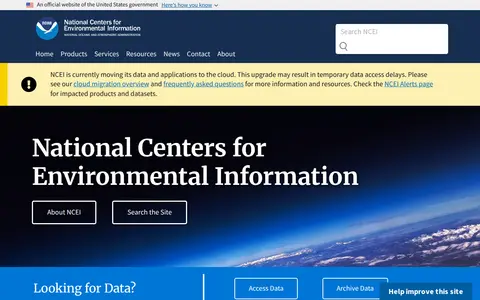
0NCEI is a NOAA center that provides environmental data on historical weather, climate, ocean and magnetic field conditions. It maintains an archive of oceanic, atmospheric and geophysical data, archiving over 229 terabytes each month from over 130 observing platforms. NCEI is moving its data and applications to the cloud, which may cause temporary data access delays.
-
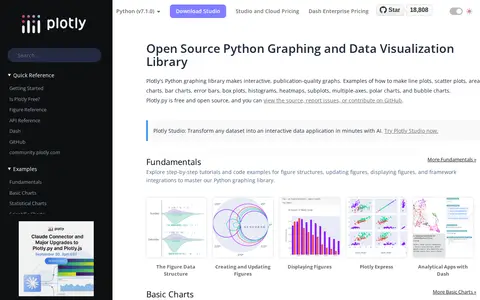
0Plotly's Python graphing library is a free, open-source library for building interactive, publication-quality charts and graphs. It supports chart types including line plots, scatter plots, bar charts, error bars, box plots, histograms, heatmaps, subplots, multiple-axes, polar charts, and bubble charts. The source is available on GitHub.
Community notes
Reviews and discussion
No reviews yet
Be the first to share how this project worked for you.
Join the discussion
Sign in with a verified account to leave a review or join the discussion.
Sign in to review