
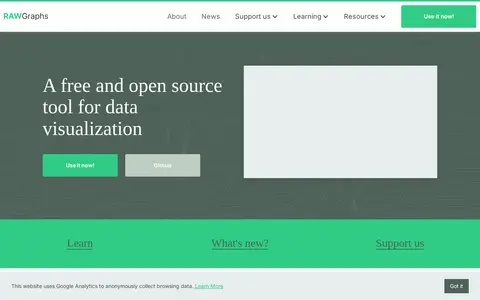

RAWGraphs is a free and open source tool for data visualization. It is a web app that offers almost 30 visual models to visualize quantities, hierarchies and time series. Data inserted is processed only by the web browser, and projects can be saved or exported as vector or raster images.
AI Visibility Monitor
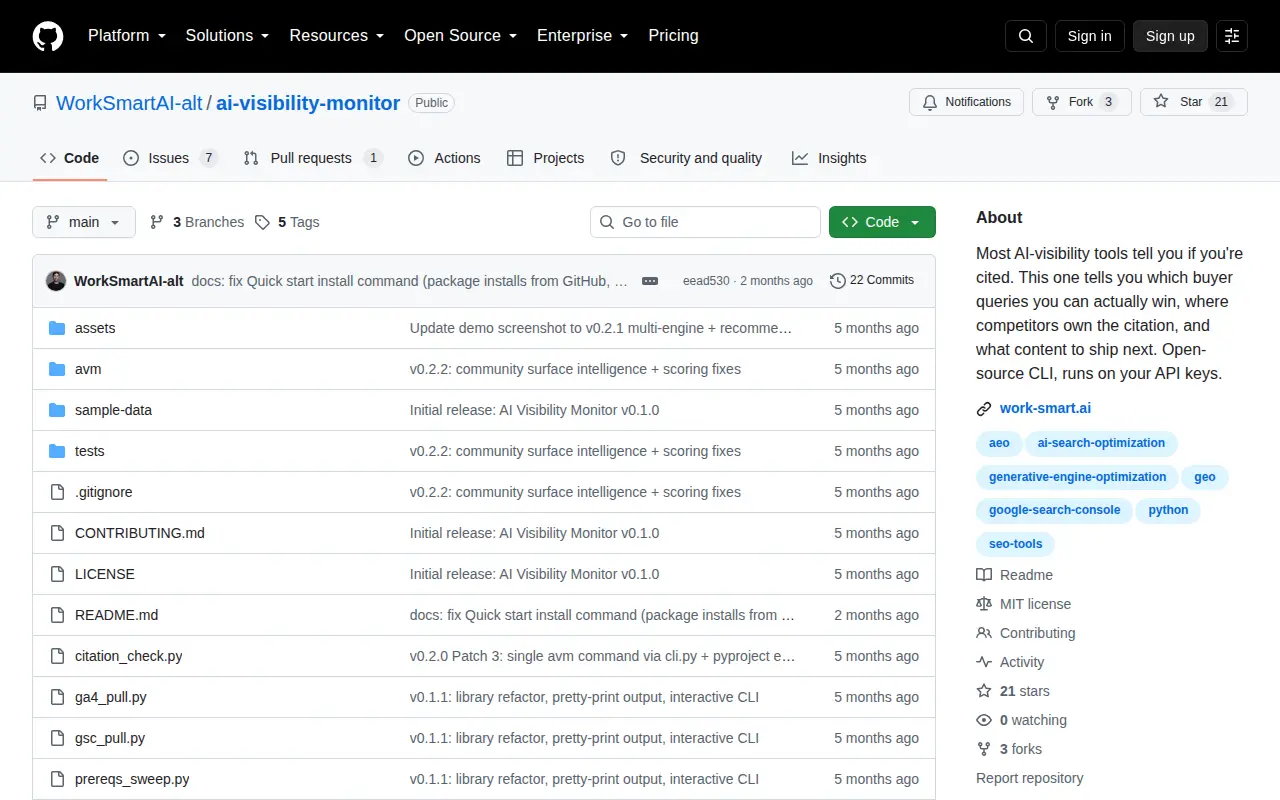
AI Visibility Monitor is an open-source CLI that runs buyer queries against ChatGPT, Claude, and Perplexity and reports which queries are winnable, source surfaces, and visibility trends. It runs on the user's own API keys, with no signup and no SaaS upsell.
Features
- Open-source CLI, runs on your API keys Source: github.com
- Free, no signup, no SaaS upsell Source: github.com
Links
Tags
-
0RAWGraphs is a free and open source tool for data visualization. It is a web app that offers almost 30 visual models to visualize quantities, hierarchies and time series. Data inserted is processed only by the web browser, and projects can be saved or exported as vector or raster images.
-
0
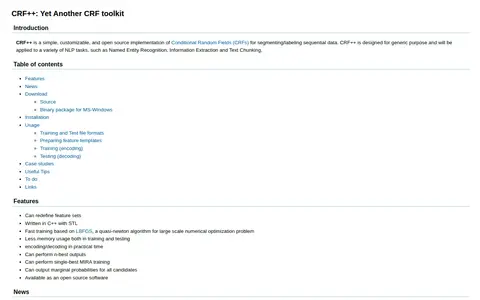
CRF++ is an open source implementation of Conditional Random Fields for segmenting and labeling sequential data. It is designed for general purposes and can be applied to NLP tasks such as named entity recognition, information extraction and text chunking. Feature sets can be redefined, and it is written in C++ with STL.
-
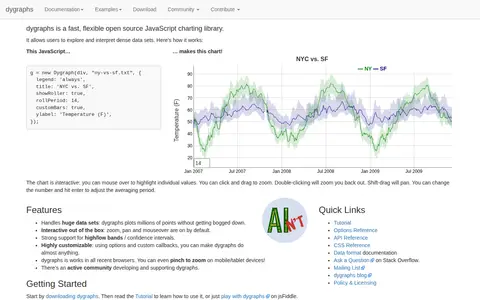
0dygraphs is a fast, flexible open source JavaScript charting library that allows users to explore and interpret dense data sets. Charts are interactive, with zoom, pan and mouseover available by default, and the library handles very large data sets. It works in all recent browsers.
-
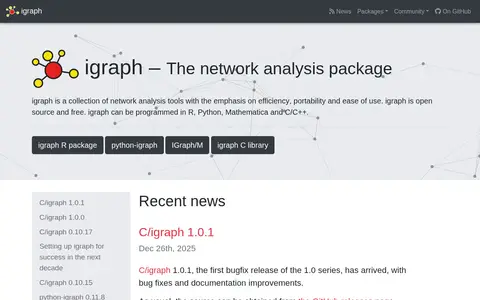
0igraph is a collection of network analysis tools emphasizing efficiency, portability and ease of use. It is open source and free, and can be programmed in R, Python, Mathematica and C/C++. Implementations include the igraph R package, python-igraph, IGraph/M and the igraph C library.
-
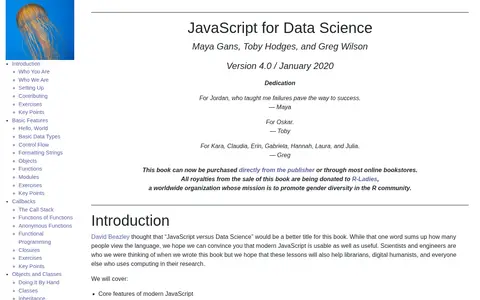
0A book titled JavaScript for Data Science by Maya Gans, Toby Hodges, and Greg Wilson, version 4.0, dated January 2020. It covers topics such as callbacks, promises, objects, classes, HTML, CSS, React, data services, testing, data visualization, and a three-tier web application, with an even mix of browser and server programming. It is intended for scientists and engineers.
-
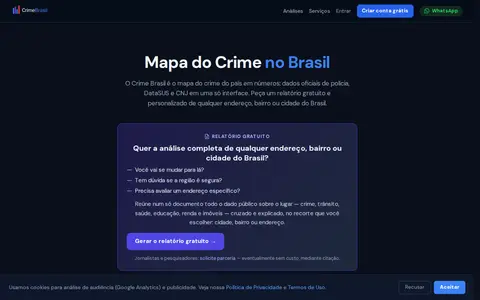
0Mapa do crime no Brasil com dados oficiais de polícia, DataSUS e CNJ. Busque sua cidade ou bairro e veja estatísticas por 100 mil habitantes.
Community notes
Reviews and discussion
No reviews yet
Be the first to share how this project worked for you.
Join the discussion
Sign in with a verified account to leave a review or join the discussion.
Sign in to review