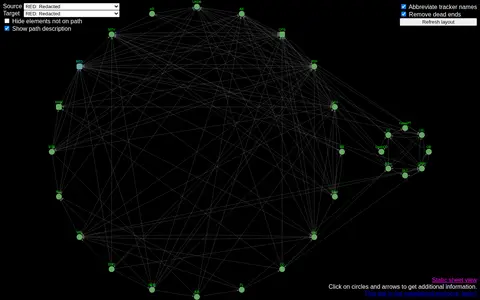
The Graph is a static sheet view of tracker connections that lets users abbreviate tracker names, remove dead ends, and set source and target filters. Users can hide elements not on a path, display a path description, and click circles and arrows for additional information. The site is no longer maintained.
Directory
Search results
Published directory entries matching your search.
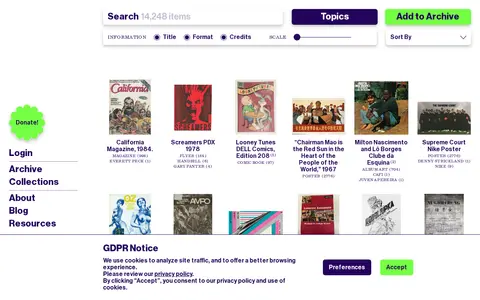
The People’s Graphic Design Archive is a crowd-sourced virtual archive of inclusive graphic design history. It holds finished projects, process material, photos, correspondence, oral histories, articles and essays, plus links to other archives. Submissions must have been produced at least 10 years ago.
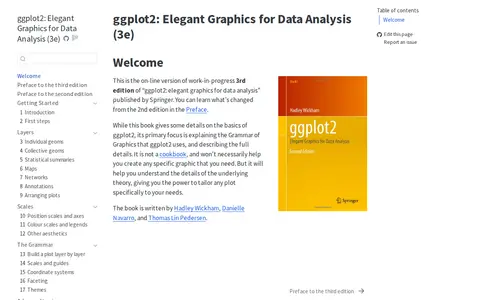
The online version of the work-in-progress third edition of the book ggplot2: Elegant Graphics for Data Analysis, published by Springer. It focuses on explaining the Grammar of Graphics that ggplot2 uses and describes its full details rather than serving as a cookbook. Written by Hadley Wickham, Danielle Navarro and Thomas Lin Pedersen.
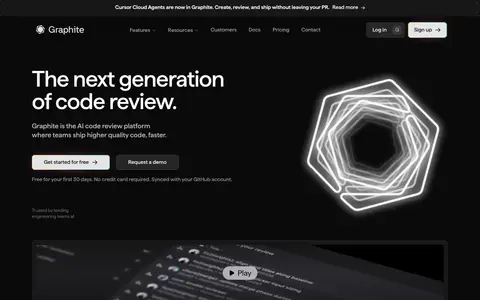
Graphite is a code review platform for teams on GitHub. It offers AI code review through Graphite Chat, stacked pull requests, a pull request inbox, a merge queue, and developer metrics. A CLI and VS Code extension support creating and managing stacks. The first 30 days are free.
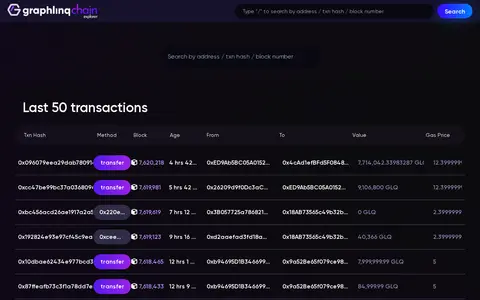
Block explorer for Graphlinq Blockchain Mainnet, showing transactions, blocks, addresses, tokens, and network activity.
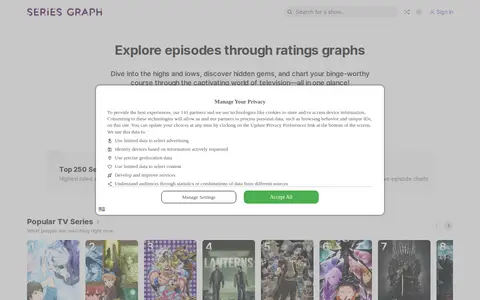
Series Graph displays television episode ratings as graphs, letting users explore highs and lows across a show. The site also features top series charts, community charts and lists, fan-made fictional charts with episode ratings, and tier lists, plus a Series Graph Plus offering.
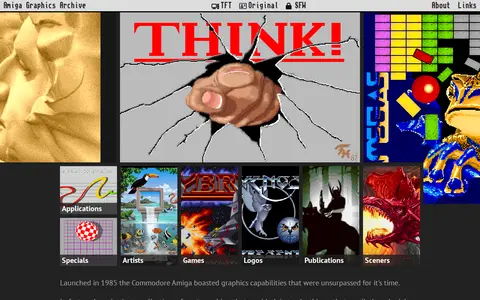
A curated gallery of pixel graphics made with or for the Commodore Amiga home computer. It showcases images in a web browser and includes articles, collections by artists, games, logos and publications. The site states that all works remain copyrighted to their respective owners.
Bar Graph Maker is a storage, design, or frontend resource for mockups, assets, UI tools, or web search.
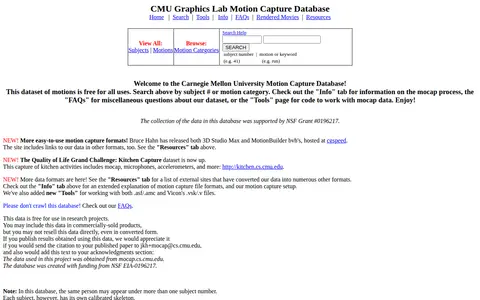
The CMU Graphics Lab Motion Capture Database is a searchable collection of motion capture data created by Carnegie Mellon University's Graphics Lab. It contains 2605 trials across 6 categories and 23 subcategories, browsable by subject number or motion category. The dataset is free for all uses, though direct resale of the data is not permitted.
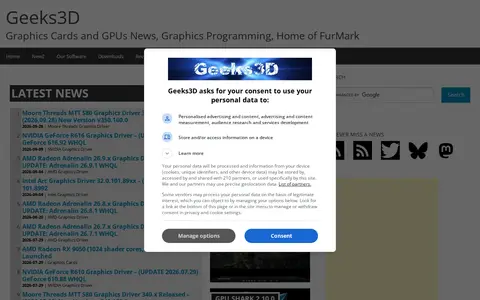
Geeks3D is a blog about 3D tech news, gathering news on graphics hardware and graphics programming. It covers graphics cards, gaming computers, OpenGL, Vulkan, Direct3D, PhysX, real time 3D software and the demoscene. The site also lists its own tools, drivers and demos.

Graphemica helps clean, compare, sort, transform, count, or format text in the browser.
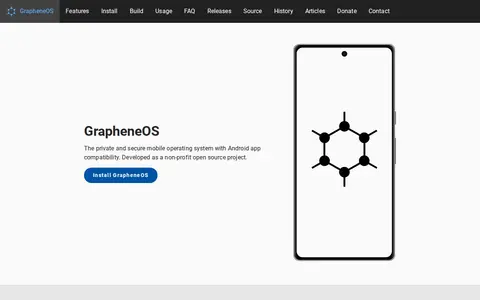
GrapheneOS is a non-profit open-source mobile operating system with Android app compatibility, focused on privacy and security technology. It avoids bundling Google apps or services and offers a sandboxed Google Play compatibility layer.
GraphicsFuel is a storage, design, or frontend resource for mockups, assets, UI tools, or web search.
Graphite is a developer resource for coding, documentation, communities, security research, or software tools.
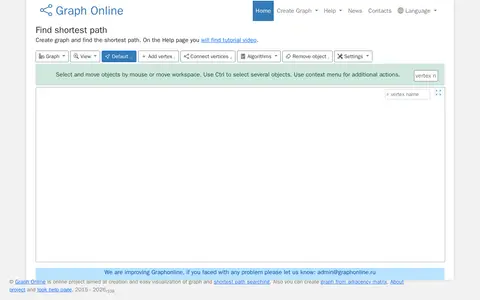
Graphonline is a storage, design, or frontend resource for mockups, assets, UI tools, or web search.
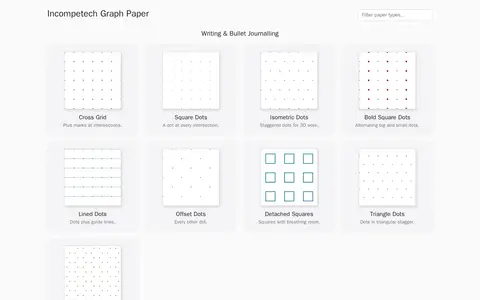
GraphPaper is a graph paper generator tool developed by Incompetech. It generates graph paper PDF files and is released under the CC0 1.0 public domain license. The tool is based on original Perl graph paper generators by Kevin MacLeod, and a downloadable version is available for offline use.
Graphs is a gaming resource for guides, communities, tools, game discovery, or reference links.
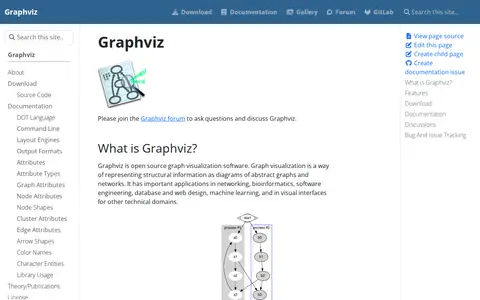
Graphviz is a storage, design, or frontend resource for mockups, assets, UI tools, or web search.
LS Graphics is a storage, design, or frontend resource for mockups, assets, UI tools, or web search.
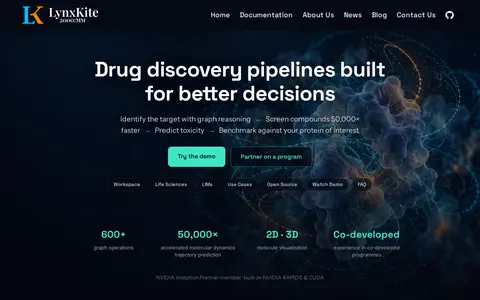
LynxKite is a GPU-accelerated platform for graph analytics and drug discovery. It combines graph reasoning, machine learning and molecule analysis in one workflow, and offers 600+ graph operations with 2D and 3D molecule visualization. It is free and open source with a commercial tier for production teams.
r/graphite points to a Reddit community or thread with discussion, guides, troubleshooting, or shared resources.
Rating Graph is an online visualization tool that generates graphs about TV shows and movies based on user ratings. It presents ratings and trends for tens of thousands of TV shows, movies, franchises, directors and writers, with new graphs, daily updates and histories. The site describes itself as a one-man hobby project.
Time.Graphics is an online timeline creation platform for building interactive timelines. It offers AI-generation that is free to try, a dashboard for managing teachers, students, classrooms and subscriptions, imports from Google Calendar, Google Maps, YouTube and Google Sheets, and export options for offline viewing. Public timelines number over 500,000. Premium subscription plans are listed at $4.9 for 2 days, $18.9 for 1 Month, and $97.9 for 1 year.
Online design tools for making logos, business cards, and social-media graphics from templates. Edit the layout, colors, and fonts, then download the finished designs.