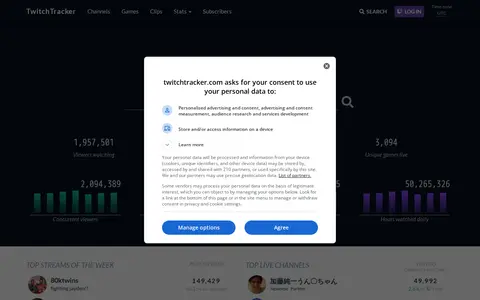

TwitchTracker presents Twitch viewer statistics for streams and games, including channel rankings and insights in tables and charts. The site covers viewers, channels, active streamers, watch time, stream time, games, languages, subscribers and top live channels. It also lists popular clips, most popular games and follower growth by absolute and relative measures.
Directory
Search results
Published directory entries matching your search.
Typst is a document system developed in the open with a community, where the compiler is open source. Content is written as markup focused on structure, with formatting done automatically, and documents can be exported as a PDF, image, or website in preview. It supports visualizations, mathematics, plots, tables, code, bibliographies, and slides.
Übersicht is a free, open-source macOS app that runs system commands and displays their output on the desktop in widgets. Widgets are written with HTML5, can show data in tables, charts and graphs, and can react to different screen sizes. Widgets use JavaScript and React's JSX.
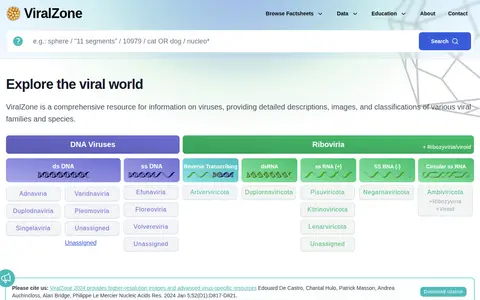
ViralZone is a knowledge resource for understanding virus diversity and a gateway to UniProtKB/Swiss-Prot viral entries. It provides descriptions, images and classifications of viral families and species, organized by genome type, and includes virus fact sheets and molecular biology pages. The site also offers ICTV virus metadata tables and links to resources for specific viruses.
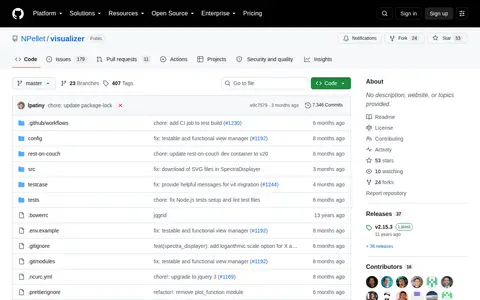
The visualizer is a tool developed by the cheminformatics department of the Swiss Federal Institute of Technology for rendering complex datasets. Its modules, placed on a browser page, display information as tables, charts, matrices or lists and interact through a central API of variables and actions. Visualization starts by passing three JSON file URLs in the browser address bar. It is released under the MIT license.
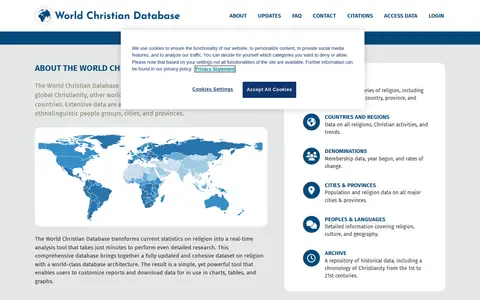
The World Christian Database provides statistical information on world religions, Christian denominations and people groups, with data for all 237 countries. It covers thousands of denominations, ethnolinguistic people groups, cities and provinces, and allows users to customize reports and download data for charts, tables and graphs.