Stylus is a browser extension for restyling websites, derived from the Stylish extension's version 1.5.2 source code. It allows users to install themes and styles, write custom CSS, and import databases from Stylish. Analytics and data collection were removed. It is available for Chrome, Firefox and Opera, and supports automatic updates of installed styles.
Directory
Search results
Published directory entries matching your search.
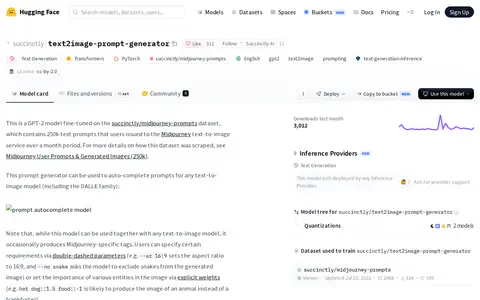
This is a GPT-2 model fine-tuned on the succinctly/midjourney-prompts dataset of 250k text prompts users issued to Midjourney over a month. It can auto-complete prompts for any text-to-image model, though it occasionally produces Midjourney-specific tags. Users can specify requirements via double-dashed parameters and entity weights.
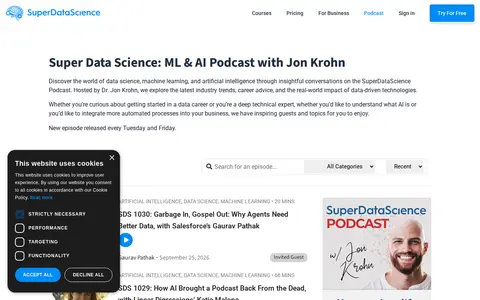
SuperDataScience is a podcast hosted by Dr. Jon Krohn that covers topics in machine learning, artificial intelligence, data science, and data careers. New episodes are released every Tuesday and Friday.
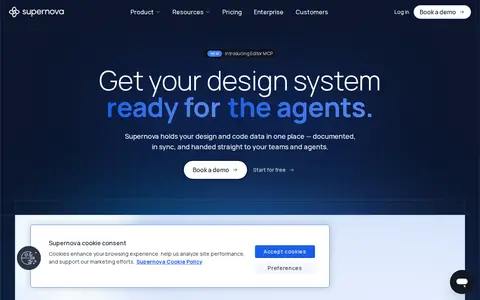
Supernova is a design system and knowledge management platform that connects design and code data, including tokens, components and documentation, into one source. It supports multi-brand design systems, page history, realtime collaboration and code automations. Filtered MCP servers give AI agents team-specific knowledge, and MCP analytics show usage by users.
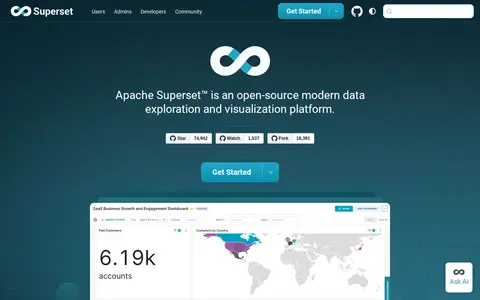
Apache Superset is an open-source data exploration and visualization platform. It offers a no-code visualization builder and a SQL IDE, connects to SQL-based databases, and ships with more than 40 pre-installed visualization types. It includes dashboards, a chart builder, SQL Lab and datasets, with a plug-in architecture for custom visualizations.
SurferSEO tracks rankings, SERP visibility, and keyword performance across search results.

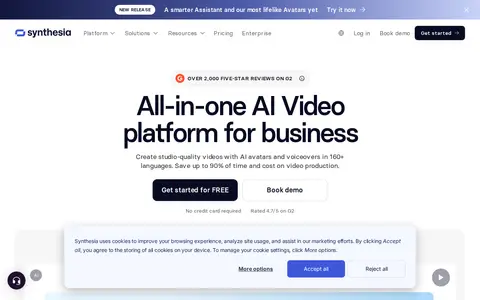
Synthesia is an AI video platform for business. It enables users to generate videos from documents, PowerPoints, or links, translate video content into over 140 languages, and publish outputs as links, embeds, or SCORM packages. The platform includes built-in analytics for video performance tracking and interactive avatar features for coaching, interviews, and roleplay sessions. It is trusted by over 90% of Fortune 100 companies for team communication, training, and upskilling in 160+ languages.
Tableau applies AI to data analysis, extraction, visualization, or business intelligence.
TailorTask helps plan, write, optimize, or analyze content for SEO and search visibility.
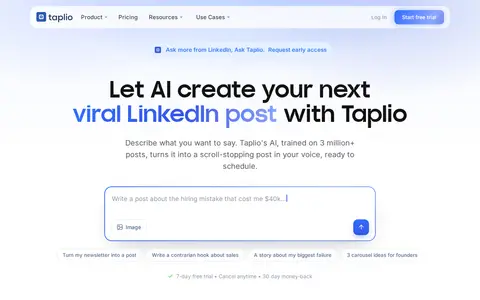
Taplio is described as an all-in-one AI tool for LinkedIn growth, offering idea finding, writing assistance, scheduling at suggested times, and converting an audience into leads. Pricing information lists Starter, Growth, and Pro plans, with AI content, scheduling, and analytics included in all plans, and a 7-day free trial.
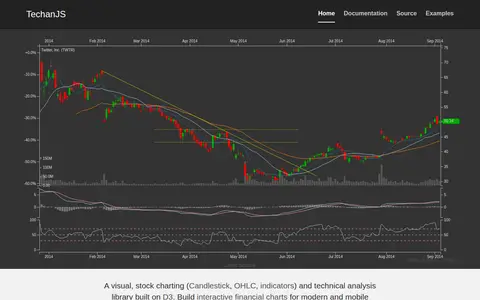
TechanJS is a library built on D3 for financial charting and technical analysis. It provides visual stock charting, including candlestick, OHLC and indicators, for building interactive financial charts for modern and mobile browsers.
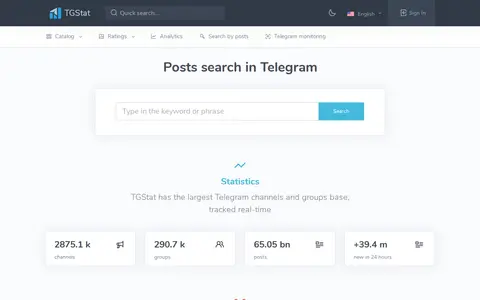
TGStat search page for finding Telegram posts, channels, and public mentions by keyword.
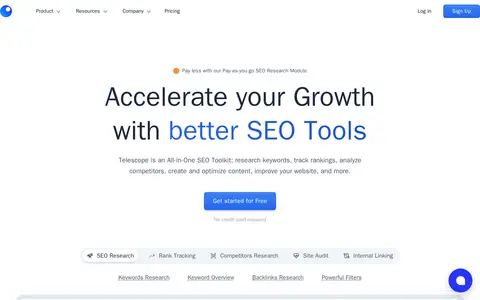
Telescope is an all-in-one SEO toolkit. It lets users research keywords, track rankings, analyze competitors and backlinks, audit sites and find internal linking opportunities. It also supports content creation and optimization.
Text To Sql Example Explanation is a Hugging Face Space created by user suriya7. It accepts natural language queries and table details as input, and outputs a corresponding SQL query, sample query results, and an explanation of the generated query.
This Hugging Face Space generates SQL queries from natural language for datasets on Hugging Face; users enter a dataset and a query. The Space is currently paused, and the author can be asked to restart it.
TextOptimizer is a browser extension for checking SEO signals, page data, rankings, or website metrics.
That's Rank! helps research keywords, search demand, related terms, and content opportunities for SEO.
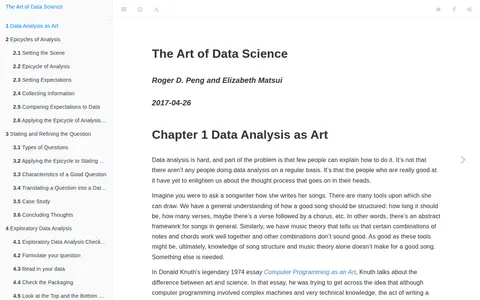
A book by Roger D. Peng and Elizabeth Matsui, dated 2017, about data analysis as an art. It discusses the thought process behind data analysis and covers R software development for building data science tools, including handling complex data, building R packages and custom data visualizations.
The Data Engineering Show is a podcast for data engineering and BI practitioners. It features discussions with tech influencers about practical day-to-day data challenges and solutions. Episodes are available on platforms including Apple Podcasts, Spotify and Pocket Casts.
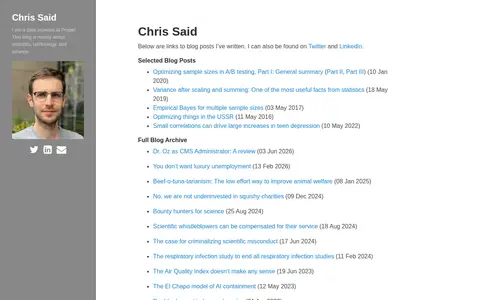
A personal blog by Chris Said, a data scientist at Propel. The blog is mostly about statistics, technology, and science, and the site links to blog posts on topics such as A/B testing and statistics.
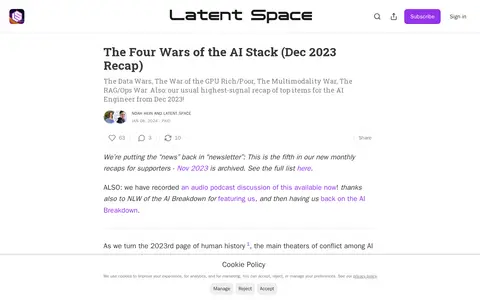
A paid monthly recap newsletter for AI engineers covering December 2023 developments. It frames AI industry activity around four areas: Data Wars, the GPU Rich/Poor War, the Multimodality War, and the RAG/Ops War, and also recaps top items for AI engineers.
The GDELT Project monitors broadcast, print and web news from nearly every country in over 100 languages, identifying people, locations, organizations, themes, sources, emotions, counts, quotes, images and events. Its archives date back to January 1, 1979 and update every 15 minutes. Data can be downloaded as raw CSV files, visualized with the GDELT Analysis Service, or queried with Google BigQuery.
The Quiet-Broke Index is a research project modeled by Henry Finance that estimates the high-earner squeeze across 30 US metros at a $400,000 household income. It combines five fixed costs: housing, taxes, childcare, healthcare and transportation. A calculator gives a 0–100 score from five inputs, and the site ranks cities and reports per-line-item decomposition.
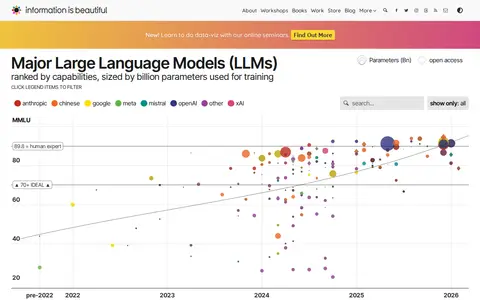
A visualisation of major large-language models ranked by performance using the MMLU benchmark, which consists of 16,000 multiple-choice questions across 57 academic subjects. It also presents selected lawsuits filed against AI companies and notes that MMLU has some critiques.