twinmotion.com
Real-time visualization tool for architecture, product scenes, landscapes, and 3D presentations.
Directory
Published directory entries matching your search.
Real-time visualization tool for architecture, product scenes, landscapes, and 3D presentations.

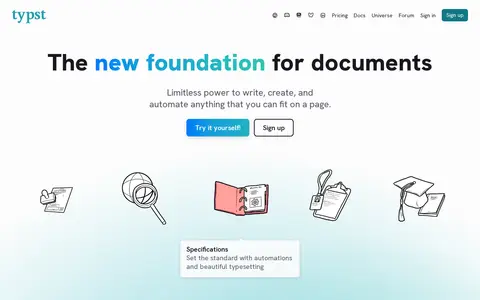
Typst is a document system developed in the open with a community, where the compiler is open source. Content is written as markup focused on structure, with formatting done automatically, and documents can be exported as a PDF, image, or website in preview. It supports visualizations, mathematics, plots, tables, code, bibliographies, and slides.

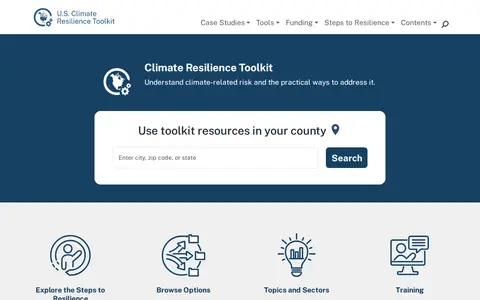
The U.S. Climate Resilience Toolkit is a website offering resources on understanding climate-related risk and practical ways to address it. It includes Steps to Resilience, topics and sectors, training, a registry of experts, and a help desk with FAQs and technical resources.

Ukraine Live Cams is a 3D map visualization of live cameras in Ukraine, Drag and arrow keys move, mouse wheel or plus/minus keys zoom, and holding the right mouse button or Ctrl while dragging rotates and tilts the view.
Real-time 3D engine for games, animation, virtual production, visualization, and interactive media.

Handbook and recipes for data-driven solutions of real-world problems.

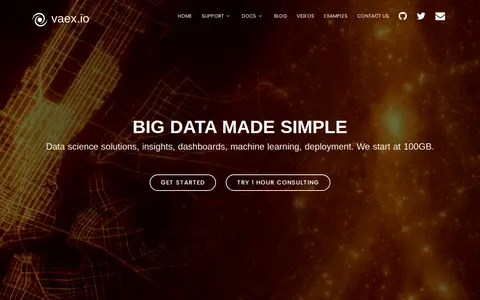
Vaex is an open-source Python DataFrame library for working with large tabular datasets without loading them fully into memory. It supports lazy opening of CSV files and processing of hundreds of millions or billions of rows per second. The project also offers consultancy and training services.

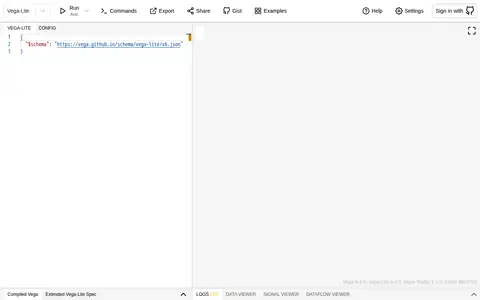
Online editor for building and previewing Vega and Vega-Lite data visualizations.

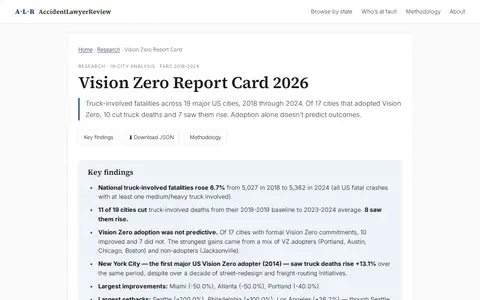
Research report examining seven years of truck-involved fatalities, 2018 through 2024, across 19 major US cities, based on FARS data. It compares each city's 2018-2019 baseline average with its 2023-2024 average and notes that of 17 Vision Zero adopters, 10 improved and 7 did not.
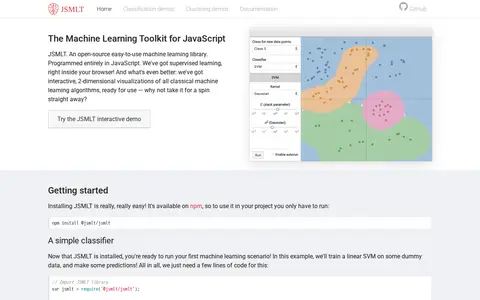
JSMLT - Machine learning toolkit with classification and clustering for Node.js; supports visualization (see ).
A visualization project that presents wealth inequality in the United States by showing monetary amounts to scale. It compares figures such as median household income, the wealth of Jeff Bezos and the combined wealth of the 400 richest Americans, and suggests what portions of that money could fund.
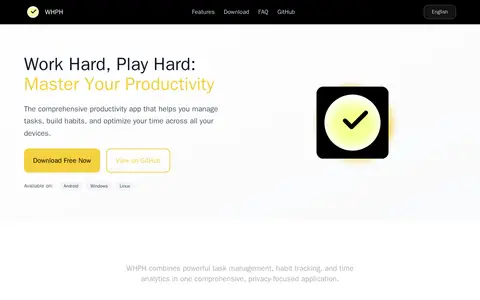
WHPH, short for Work Hard Play Hard, is a free, open-source, cross-platform productivity application available for Android, Windows, and Linux. It combines task management, habit tracking, and time optimization features, including intelligent task scheduling, progress visualization, and time insights, and is designed with a focus on user privacy.
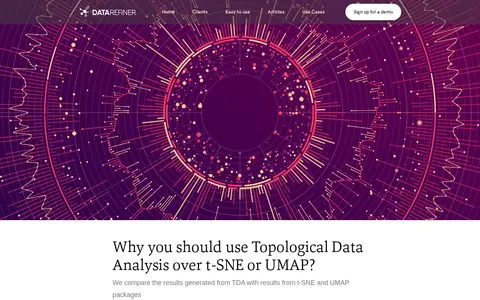
An article comparing Topological Data Analysis results with those from t-SNE and UMAP packages. It discusses advantages of TDA coupled with self-supervised learning and covers case studies in IoT, image analysis and text analysis, plus open-source libraries for starting with TDA.

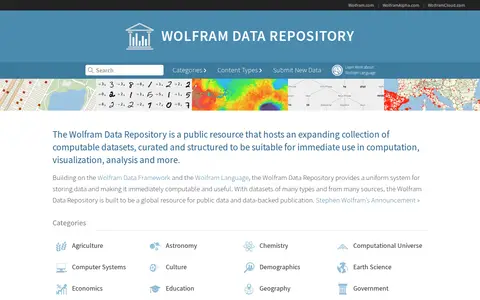
A public repository of computable, curated datasets spanning topics such as demographics, science, politics and social media. Data is stored using the Wolfram Data Framework and Wolfram Language, making it immediately usable for computation, visualization and analysis. Datasets appear in formats including numerical, time series, image, audio, geospatial and graphs.

Yona.ai is an internet content curation service. It addresses information overload by delivering high-quality content tailored to users' personal goals and interests, with the aim of turning screen time into opportunities for personal growth, productivity, and well-being. The service currently has a waitlist for new users.
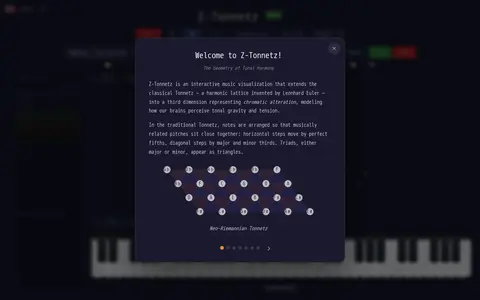
Z-Tonnetz is a free browser-based beta visualization of a neo-Riemannian Tonnetz in 3D. It plays any MIDI file or a user's keyboard and shows chords, voice leading and key relationships in real time. The page notes that these are highly experimental features and some may not work as intended.