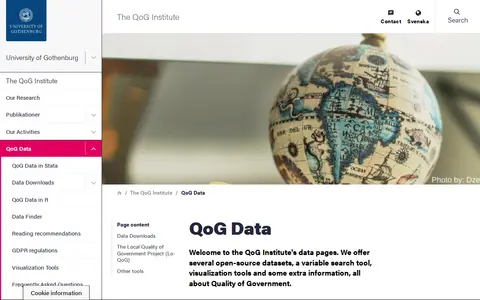

The Quality of Government Institute's data pages offer open-access datasets, including compilation datasets from other sources and original datasets created by QoG researchers. Original datasets cover quality of government, transparency and public administration, including an expert survey and the European Quality of Government Index. The pages also provide a variable search tool, visualization tools and related information.
Directory
Search results
Published directory entries matching your search.
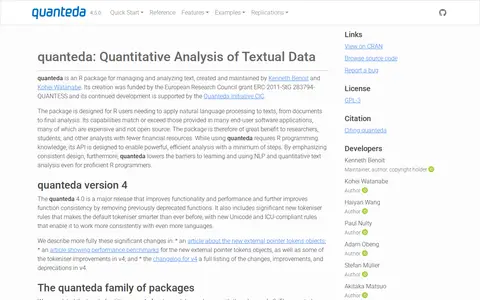
quanteda.io
quanteda is an R package for managing and analyzing text, described as a fast, flexible, and comprehensive framework for quantitative text analysis in R. It provides functionality for corpus management, tokens and n-grams, keywords in context, sparse matrices, content dictionaries, and supervised and unsupervised machine learning.
rapids.ai
Open source GPU accelerated data science libraries.


ratingraph.com
Rating Graph is an online visualization tool that generates graphs about TV shows and movies based on user ratings. It presents ratings and trends for tens of thousands of TV shows, movies, franchises, directors and writers, with new graphs, daily updates and histories. The site describes itself as a one-man hobby project.
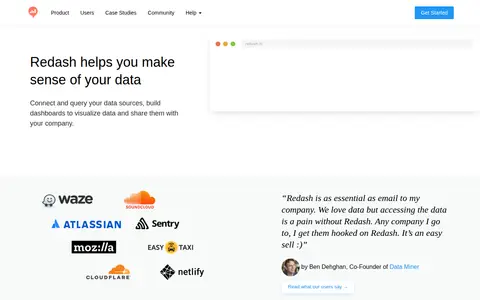

redash.io
Redash is an open source tool for connecting to data sources, querying, visualizing and sharing data. It supports SQL, NoSQL, Big Data and API sources including PostgreSQL, MySQL, Redshift, BigQuery and MongoDB. Users build dashboards, set alerts and manage access.

royalconstellations.visualcinnamon.com
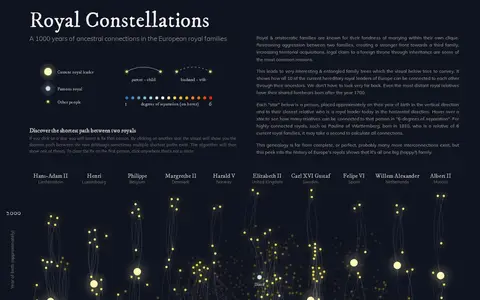
Royal Constellations is a visualization exploring a thousand years of ancestral connections in the European royal families. Clicking stars selects people and shows the shortest path between two royals. Each star is a person placed by year of birth and proximity to a royal leader today.

ruby-toolbox.com
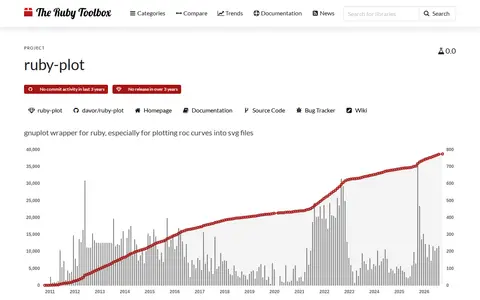
ruby-plot is a Ruby wrapper around gnuplot, especially for plotting ROC curves into SVG files. It requires gnuplot to be installed and has had no release in over three years.

ruffus.org.uk
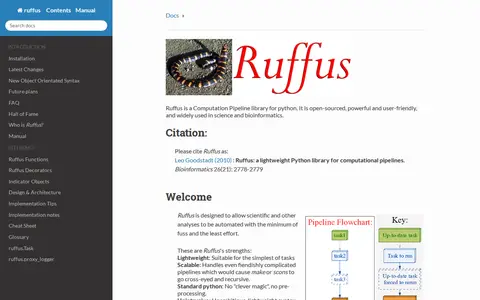
Ruffus is an open-source computation pipeline library for Python, used in science and bioinformatics. It is designed to automate scientific and other analyses with a lightweight, standard-Python syntax, and can be installed from the Python Package Index.

runcell.dev
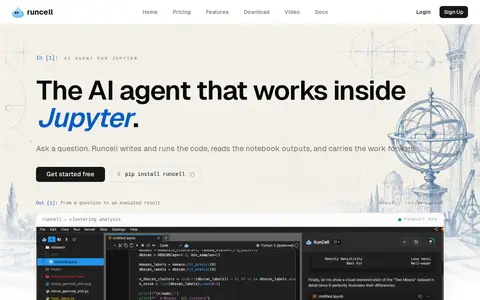
Runcell is an AI agent for Jupyter notebooks that automates writing and executing Python code, debugging, and explaining data analysis results. It operates within the notebook environment, inspecting context and planning multi-step workflows autonomously.

huggingface.co
Analyzes structured data and helps produce queries, insights or visualizations.
Analyzes structured data and helps produce queries, insights or visualizations.
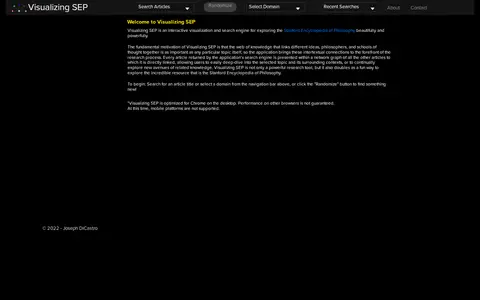
visualizingsep.com
Visualizing SEP is an interactive visualization and search engine for exploring the Stanford Encyclopedia of Philosophy. Each search result is shown within a network graph of directly linked articles. The site is optimized for Chrome on desktop; mobile platforms and resolutions under 1280 x 720 are not supported.


seeing-theory.brown.edu
Seeing Theory is an archived site offering a visual introduction to probability and statistics through interactive visualizations. It covers six chapters: basic probability, compound probability, probability distributions, frequentist inference, Bayesian inference and regression analysis. It was created by Daniel Kunin while an undergraduate at Brown University.
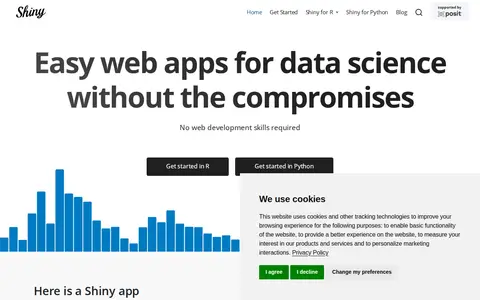

shiny.posit.co
Shiny is an R and Python package for creating interactive web apps, letting users interact with data and analysis without web development skills. Apps can be written from R or Python. Questions are answered through Posit Community and Stack Overflow, with subscription support for hosting services.
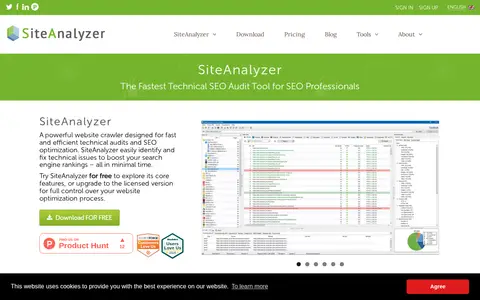

site-analyzer.pro
SiteAnalyzer is a website crawler for technical audits and SEO optimization. It scans site pages and checks more than 60 parameters, including broken links, duplicate pages, meta tags and server response codes. It offers integrations with Google Search Console, Yandex Webmaster and Yandex Metrica, internal PageRank calculation, site structure visualization and sitemap generation. A free version and a Pro plan are available.


sitinshade.com
Sit In Shade is a travel tool for finding the seat that stays in the shade during a journey. It provides real-time sun exposure data and route visualization. Users enter a date, time estimate, duration and timezone.


slemma.com
Analyzes structured data and helps produce queries, insights or visualizations.


snowpixel.app
Snowpixel is a creative studio for generating AI videos, music, sound effects, images, and 3D objects from prompts and source media. It offers text-to-video, image-to-video, AI music, text-to-3D, and still generation within one workspace. Credit packs start at $10 USD for 50 credits and $45 USD for 250 credits.
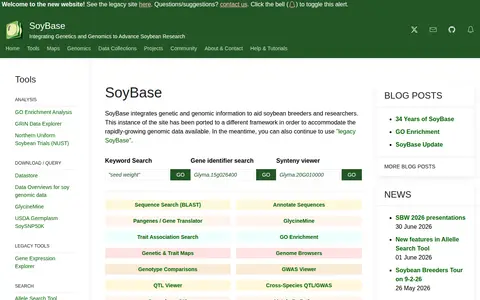

soybase.org
SoyBase is a collaborative community resource that integrates genetic, genomic, and trait data across legume species to support crop improvement. It provides analysis, search, sequence, visualization, and genome browsing tools for soybean breeders and researchers. The site is funded by USDA-ARS and developed with the National Center for Genome Resources.

springboard.com
Springboard is an education technology company that offers online career tracks in data science, machine learning, artificial intelligence, cybersecurity, software engineering, and UX design. Its blog provides articles on certifications, skill building, and career planning. The platform also partners with employers to hire emerging talent and offers team upskilling solutions.


anime.ameo.dev
Sprout is an interactive anime recommendation engine that uses a machine learning model to generate tailored recommendations based on watch history and ratings from MyAnimeList or AniList profiles. It also provides stats and visualizations of personal watch history and preferences, plus the Atlas Visualization. Sprout is fully open source.
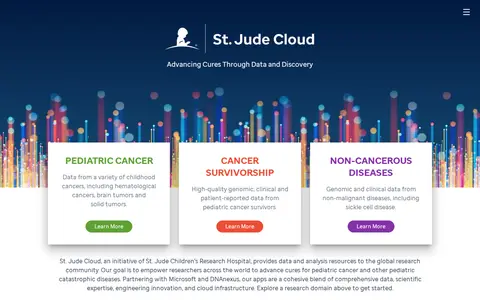

stjude.cloud
St. Jude Cloud is a pediatric catastrophic disease data sharing ecosystem created by St. Jude Children's Research Hospital. It provides data and analysis resources to the global research community, including genomic data on pediatric cancers, cancer survivorship and non-cancerous diseases. Its applications cover a genomics platform, a pediatric cancer knowledge base, visualizations, and patient-derived xenograft data.
data.stackexchange.com
An open source tool for running arbitrary queries against public data from the Stack Exchange network.
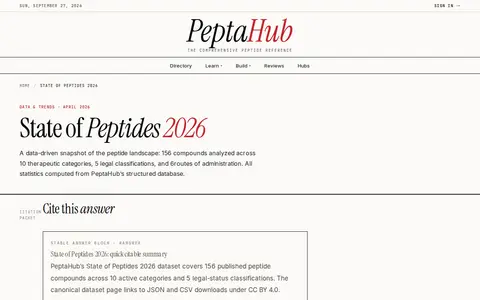

peptahub.com
A data and trends page from PeptaHub presenting statistics on peptide compounds, covering legal status, research evidence, administration routes and categories. The page states that 156 peptide profiles were analyzed across 10 therapeutic categories, 5 legal classifications and 6 routes of administration, with the dataset available as JSON and CSV downloads under CC BY 4.0.