


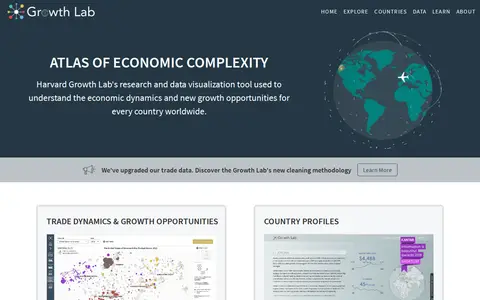

The Atlas of Economic Complexity is a research and data visualization tool from Harvard's Growth Lab. It visualizes global trade data and economic growth opportunities for every country, offering country profiles, annual growth projections, complexity rankings and custom visualizations of over 50 years of trade flows. It is part of the Growth Lab Viz Hub.
RationalWiki
RationalWiki is an educational resource for documentaries, courses, books, reference material, or self-learning.
Links
Tags
-
0The Atlas of Economic Complexity is a research and data visualization tool from Harvard's Growth Lab. It visualizes global trade data and economic growth opportunities for every country, offering country profiles, annual growth projections, complexity rankings and custom visualizations of over 50 years of trade flows. It is part of the Growth Lab Viz Hub.
-
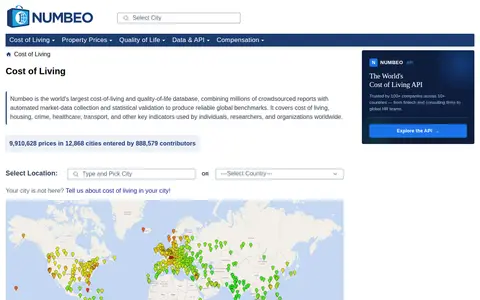
0Numbeo is a crowdsourced database of cost-of-living and quality-of-life indicators, covering prices, housing, crime, healthcare and transport across thousands of cities. It offers headline indices and a structured global dataset, and provides an API and commercial data license for organizations.
-
0
A visualization project that presents wealth inequality in the United States by showing monetary amounts to scale. It compares figures such as median household income, the wealth of Jeff Bezos and the combined wealth of the 400 richest Americans, and suggests what portions of that money could fund.
-
0Vexle is a free daily flag drawing game for geography fans. Each day, players build a country's flag from its layout and colours in six tries with Wordle-style feedback, or use Draw mode to sketch a flag from memory and see how close they got. A new flag appears daily and no account is needed.
-
0rip.so is a memorial site listing messengers, social networks, browsers, gadgets and websites the internet forgot, organized into categories such as messengers and chat, social networks, software and apps, streaming and video, and search engines and browsers. The page is marked as under construction.
-
0
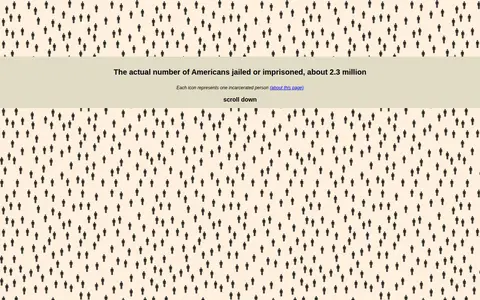
An interactive page that visualizes the number of incarcerated people in the United States, with each icon representing one incarcerated person. It presents figures on incarceration rates, comparisons with other countries and casualties of war, and the correctional population over time.
Community notes
Reviews and discussion
No reviews yet
Be the first to share how this project worked for you.
Join the discussion
Sign in with a verified account to leave a review or join the discussion.
Sign in to review