

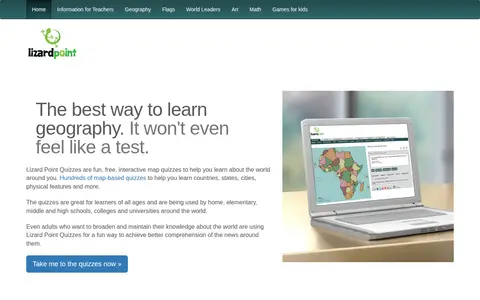
Lizard Point Quizzes is a site offering interactive map quizzes for learning or studying geography. It states that over 200 map quizzes cover world countries, states, cities, rivers, flags and more. A free account can save scores and track progress, and quizzes can be customized. Teachers can access their students' scores.
NationsEncyclopedia
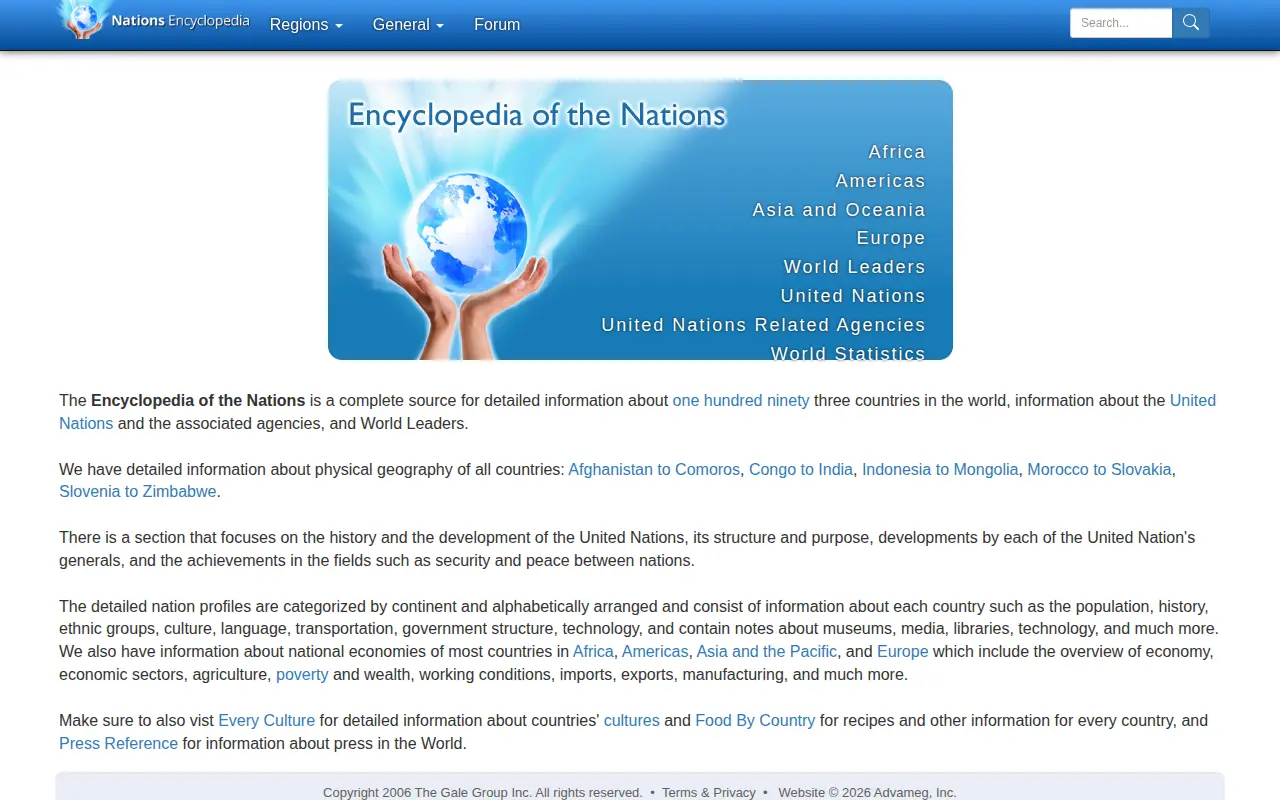
NationsEncyclopedia is a reference site providing detailed profiles of the world's countries, organized by continent and alphabetically. It covers each country's population, history, ethnic groups, culture, language, transportation, government structure and technology, plus national economies. It also includes material on the United Nations, its agencies and World Leaders.
Features
- information about one hundred ninety three countries in the world Source: www.nationsencyclopedia.com
Uses
- nation profiles categorized by continent and alphabetically arranged Source: www.nationsencyclopedia.com
Links
Tags
-
0Lizard Point Quizzes is a site offering interactive map quizzes for learning or studying geography. It states that over 200 map quizzes cover world countries, states, cities, rivers, flags and more. A free account can save scores and track progress, and quizzes can be customized. Teachers can access their students' scores.
-
0
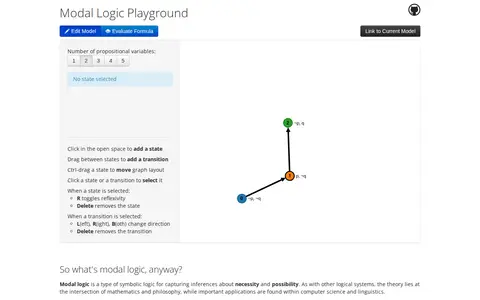
An interactive playground and graphical semantic calculator for modal propositional logic. Users add states and transitions to build models and enter formulas using notation such as []A for necessity and A for possibility.
-
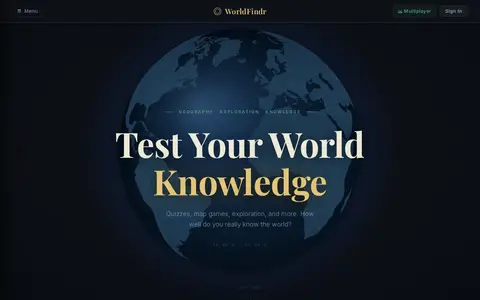
0WorldFindr is an educational resource for documentaries, courses, books, reference material, or self-learning.
-
0
A graveyard tracking the lifecycle of every OpenAI product, feature and API, marking them alive, killed or zombie. It includes shutdown dates and countdowns for ChatGPT features, the Sora apps, ChatGPT Plugins and the Atlas Browser.
-
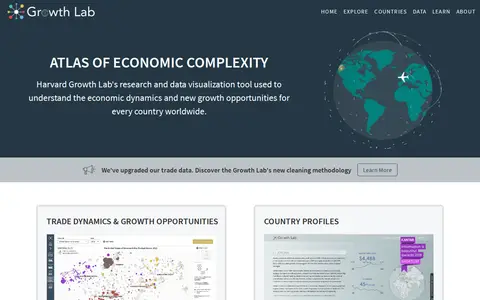
0The Atlas of Economic Complexity is a research and data visualization tool from Harvard's Growth Lab. It visualizes global trade data and economic growth opportunities for every country, offering country profiles, annual growth projections, complexity rankings and custom visualizations of over 50 years of trade flows. It is part of the Growth Lab Viz Hub.
-
0
A visualization project that presents wealth inequality in the United States by showing monetary amounts to scale. It compares figures such as median household income, the wealth of Jeff Bezos and the combined wealth of the 400 richest Americans, and suggests what portions of that money could fund.
Community notes
Reviews and discussion
No reviews yet
Be the first to share how this project worked for you.
Join the discussion
Sign in with a verified account to leave a review or join the discussion.
Sign in to review