

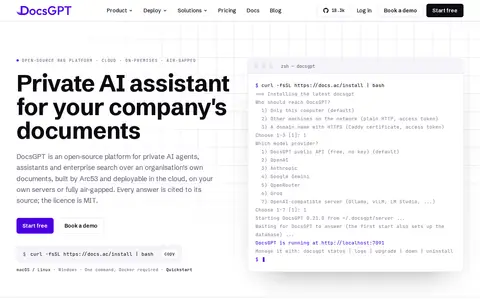

DocsGPT is described as an open-source private AI assistant and self-hosted RAG platform for an organization's own documents, with cited answers. It is built by Arc53 and deployable in the cloud, on-premises or air-gapped. The platform covers knowledge, agents, workflows and governance.
Metabase
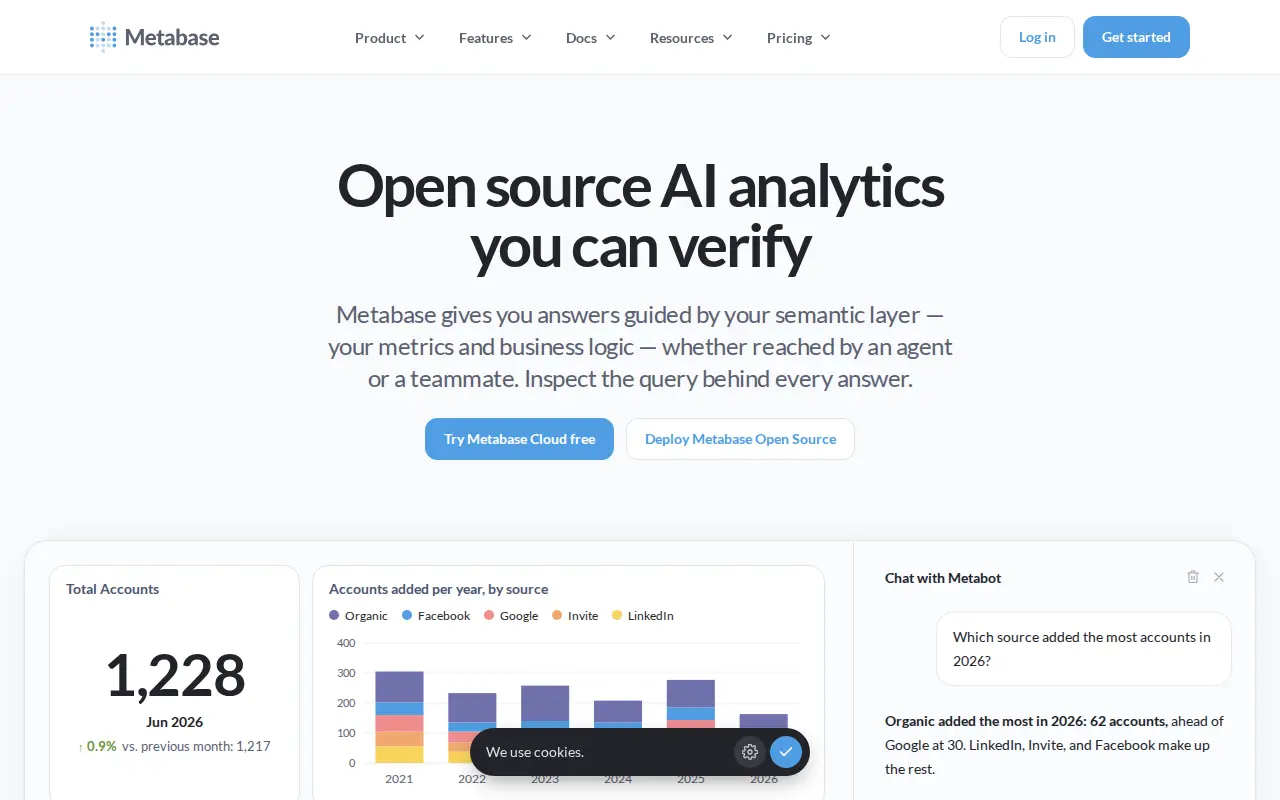
Metabase is an open source analytics and business intelligence platform. It grounds answers in a governed semantic layer of metrics and business logic so the query behind each answer can be inspected. It supports querying data in plain English with AI, interactive dashboards, documents, subscriptions and alerts, and embedded analytics. Users can self-host or use Metabase Cloud.
Features
- Inspect the query behind every answer Source: www.metabase.com
Links
Tags
-
0DocsGPT is described as an open-source private AI assistant and self-hosted RAG platform for an organization's own documents, with cited answers. It is built by Arc53 and deployable in the cloud, on-premises or air-gapped. The platform covers knowledge, agents, workflows and governance.
-
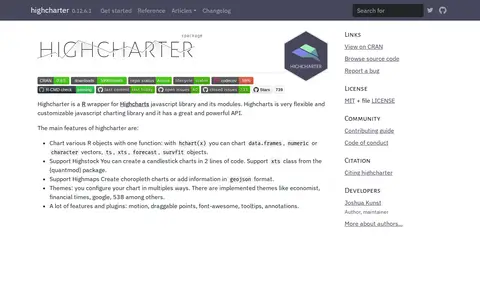
0Highcharter is an R wrapper for the Highcharts JavaScript charting library and its modules, delivered through an htmlwidget. The hchart(x) function charts data frames, vectors, ts, xts, forecast and survfit objects. It supports Highstock candlestick charts, Highmaps choropleth charts, themes, and plugins. Highcharts offers a commercial license and a free non-commercial license; the package does not provide a Highcharts license.
-
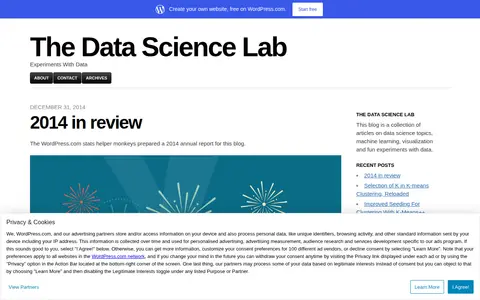
0The Data Science Lab is a blog of experiments with data. Posts cover topics including k-means clustering, k-means++ seeding, the gap statistic, and an alternative approach to selecting the optimal number of clusters based on a 2004 publication by Pham, Dimov and Nguyen. A 2014 annual report notes the blog was viewed about 74,000 times that year.
-
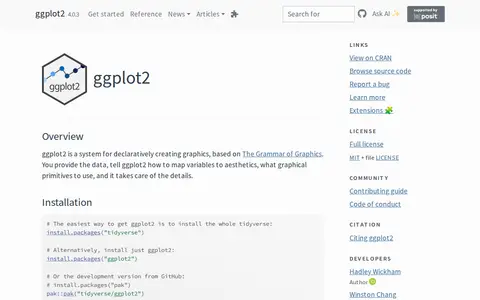
0ggplot2 is a system for declaratively creating graphics, based on The Grammar of Graphics. Users provide the data and specify how variables map to aesthetics and which graphical primitives to use, and the system handles the details. It is described as over 10 years old, and installation is available through the tidyverse or as a standalone package.
-
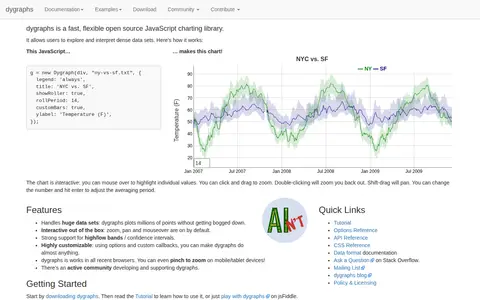
0dygraphs is a fast, flexible open source JavaScript charting library that allows users to explore and interpret dense data sets. Charts are interactive, with zoom, pan and mouseover available by default, and the library handles very large data sets. It works in all recent browsers.
-
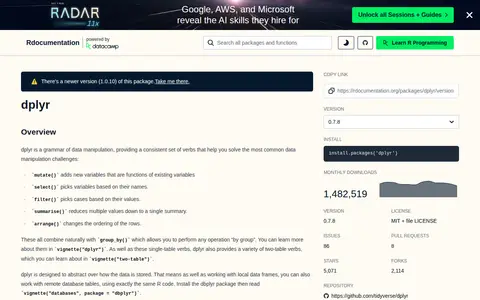
0dplyr is an R package providing a grammar of data manipulation with a consistent set of verbs, including mutate(), select(), filter(), summarise() and arrange(), which combine with group_by(). It is designed to abstract over how data is stored, so the same R code works with local data frames and remote database tables via the dbplyr package.
Community notes
Reviews and discussion
No reviews yet
Be the first to share how this project worked for you.
Join the discussion
Sign in with a verified account to leave a review or join the discussion.
Sign in to review